Head and Shoulders and Inverted Head and Shoulders Pattern- Steemit Crypto Academy- S5W2- Homework post for @utsavsaxena

Cover Page Created by me, @msquaretk | Created with imarkup app
Hello Stemians.
It is the second week of the season 5 in the Crypto Academy. The first week was awesome as it was full of lessons from different Professors. This week will be another experience as I have started learning new things entirely.
This post is written in response to Professor @utsavsaxena11. He taught "Trading Strategy for Head and Shoulders and Inverted Head and Shoulders Pattern." He explained the topic very well and gave us the trading strategy, entry and exit for the pattern. I will be answering the questions given in the next paragraphs. Please, follow me closely.

1. Explain Head and Shoulder and Inverse Head and Shoulders patterns in details with the help of real examples. What is the importance of voulme in these patterns(Screenshot needed and try to explian in details)
In finance trading, there are two methods of analysing the market: fundamental and technical analysis. Fundamental analysis deals with the use of financial statement, events, news and other statistical measures to determine the movement of price of an asset. While technical analysis deals with the use of technical tools to analyse price graph or chart which shows the past behavior of buyers and sellers do as to determine the movement of price.
One of the technical tools is chart pattern. There are different types of charts pattern. We have chart pattern which are trend reversal pattern and those which are trend continuation pattern. The head and shoulder and inverted head and shoulder pattern are trend reversal pattern.
Head and Shoulder Pattern
Head and shoulder pattern is a chart pattern that forms when the trend wants to change from bullish to bearish. The pattern consists of three peaks with the highest one be the head and the remaining two are shoulders. It's one of the reliable chart patterns and because of its effectiveness, the traders look for it.
It consists of the two shoulders and one head. The first shoulder, left shoulder is formed creating a peak, then price deep lower and later price rises up to form the head which is higher than the shoulder it first created. So, after the creation of the head, price fails to go up, not able to rise above the head, thus creating the right shoulder which is very similar to the left shoulder.
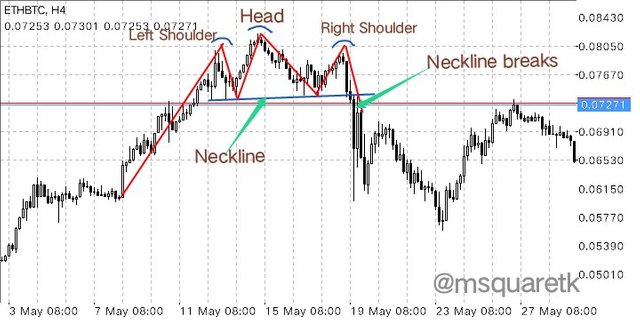
The screenshot below shows the head and shoulder pattern.
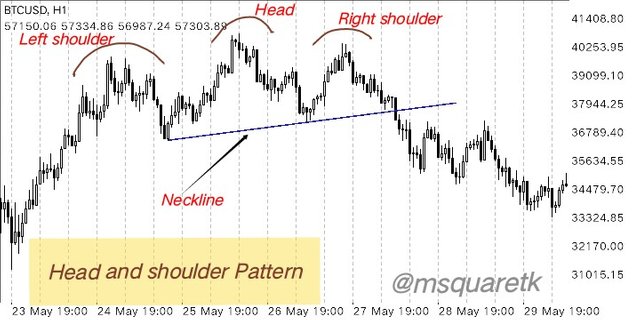
Graphical Representation of Head and shoulders pattern | Screenshot from my MT4 App
Inverted Head and shoulders pattern
Inverted Head and shoulders pattern is a direct opposite of head and shoulder pattern. It's the pattern that forms which has probability of turning bearish trend to bullish. It consists of three lows known as inverted left shoulder, inverted head and right shoulder.
This pattern is found in a bearish market and when spotted by trades they take advantage and position themselves to enter a bullish matket. The first formation is Inverted left shoulder which is formed when the price make a low and after this, price rises up a bit. But, the price falls and below the inverted left shoulder which makes inverted head. This head is the lowest point of price. And lastly, inverted right shoulder forms which I similar to that of inverted left shoulder.
Below shows the screenshot of inverted head and shoulder.
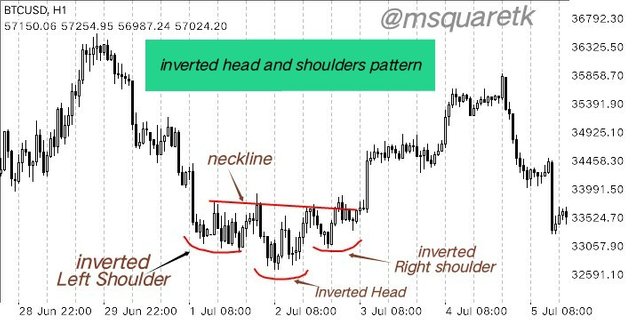
Graphical Representation of Inverted Head and shoulders pattern | Screenshot from my MT4 App
Significance or Important of Volume on head and inverted head and shoulders pattern.
Volume plays a vital role in the formation of these patterns. For head and shoulder pattern, the formation of left shoulder is seen with a very great volume, showing that the buyers are still very aggressive in momentum, but the volume decreases as the head forms showing that the momentum of buyers have being reduced. The right shoulder also should show a light volume, this will indicate that the buyers are exhausted. But once the neckline breaks, the volume should be very great.
On the other hand, for inverted head and shoulders pattern, the inverted head shows a great volume. But the volume of the inverted head is not that great as the sellers opt out the market. Although the rally up of this inverted head should show volume being regained which is the the sign that the buyers and taking over. The inverted right shoulder also will show a light volume, and as the neckline breaks, a very great volume will be seen.
See the screenshot below.
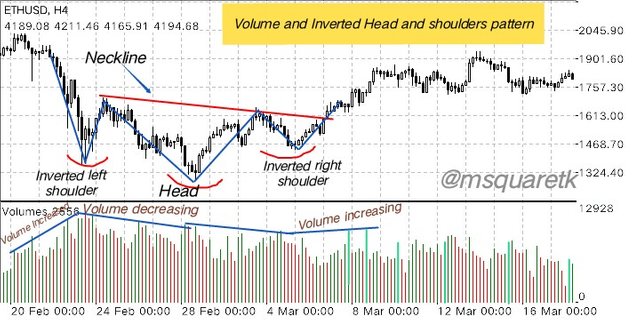
Graphical Representation Importance volume on Inverted Head and shoulders pattern | Screenshot from MT4 App
2. What is the psychology of market in Head and Shoulder pattern and in Inverse Head and Shoulder pattern (Screenshot needed)
In this task, I am going to be explaining the psychology behind the formation of these patterns. Let's start with head and shoulders pattern
Psychology Behind the Formation of Head and Shoulders Pattern.
Head and shoulders pattern is a pattern that is formed in a bullish trend and it often at the close of this trend. Like I said earlier, it has or comprises three peaks formation. They are: left shoulder, head and right shoulder.
In a bullish trend, the buyers push the price of an asset up and the influence of sellers are little felt when there's a pull back of the prevailing leg of the main trend. So, when the price of an asset is rising, buyers are in control.
The first thing that forms in head and shoulders pattern is left shoulder. It forms when the buyers are still very aggressive in the market. The buyers pushes the price up which forms the first peak (left shoulder). But as soon as this peak forms, the sellers enter the market and drives the price downward creating the beginning of the neckline.
The buyers then resumes and drive the price with great momentum which is higher than the left shoulder. This is the second peak which is called the head. Then, the sellers still drive the price downward which create the low which is often joined with the first low created. Then later, buyers enter back with the sense to continue the driving of price up, but they couldn't drive it higher than the head before they are exhausted. This third peak forms the right shoulder.
See the screenshot below.
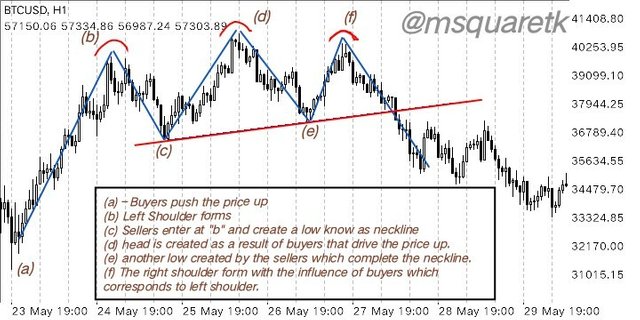
Illustration of Psychology Behind Formation of Head and shoulders pattern | Screenshot from MT4 App
Psychology Behind the Formation of Inverse Head and Shoulders Pattern.
The inverse head and shoulders pattern is a reversal pattern which is found at the bottom of a bearish trend. This pattern is a reliable one which traders often look for to enter a bullish trend. It consists of three lows which are called **inverted left shoulder, inverted head and inverse or inverted right shoulder.
In the formation of this pattern, price must be bearish and the first thing that forms is inverse left shoulder. It forms as a result of sellers dragging the price downward with a very great momentum. But shortly, the effect of buyers is felt and they drive the price up which is often the beginning of the neckline. Then, the sellers snatched the price and the bearish trend continues downward. This movement rally down than the inverted left shoulder, thus it creates inverse head
The inverse head created shows a very low volume. At this stage, the buyers are already stepping in the market. Hence, they drive the price up which Crete a high that complete the neckline. But sellers didn't want to agree, thus they later drag the price downward. But his time around, it can't be lower than the inverse head, thus an Inverse right shoulder is formed corresponding to the left inverted shoulder. Once the neckline is broken, the traders can open a buy entry. See the screenshot below.
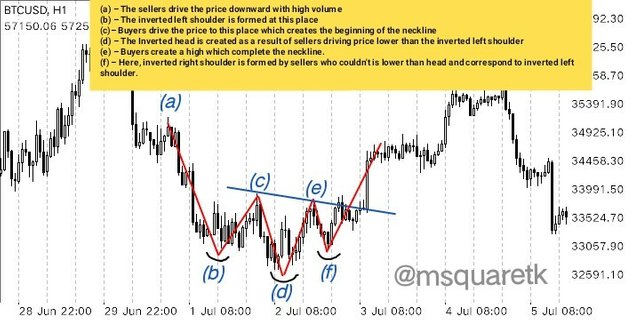
Illustration of Psychology Behind Formation of Inverted Head and shoulders pattern | Screenshot from MT4 App
3.Explain 1 demo trade for Head and Shoulder and 1 demo trade for Inverse Head and shoulder pattern. Explain proper trading strategy in both patterns seperately. Explain how you identified different levels in the trades in each pattern(Screenshot needed and you can use previous price charts in this question)
In this task, I am going to be explaining a demo trade or simulation for head and shoulder pattern and a demo or simulation trade for inverse or inverted head and shoulder pattern. Let's begin with head and shoulder pattern.
Explanation of Demo or Simulation Trade for head and shoulder pattern
Now to trade head and Shoulders Pattern, price must be in an uptrend. We know that this pattern forms at extreme peak area of the bullish trend. So, the first thing to note is to look for a market that's trending upside.
Then, the next thing is to look for the formation of the left shoulder which is often the first thing that forms in the pattern. Then we wait for the head to form as well as the right shoulder. Once we have this, we already have the formation.
The next thing to do is to draw the neckline by using trendline to connect the lower ends of these peaks together.
Now after the trendline has been drawn, we wait for the price to break the neckline. Now, since it's head and shoulder pattern, the price will have to break the neckline downward and this is when the right shoulder has been formed.
Trade Simulation using Head and shoulders pattern Strategy | Screenshot from MT4 App
Entry
Now, to enter the trad using this strategy, the price must break the neckline downward. Once it breaks, the next candle that forms after the is for the entry. However, safe traders wait for the retest of the neckline.
Stop loss
Stop loss is placed at the the level of the right shoulder. If the price goes back to that place that means the setup is invalid.
Take Profit or Target
For the target, this is how it's been calculated.
- First measure the difference of head peak level and the low point of either shoulder.
- The difference is then subtracted from the neckline price.
As it is seen, the peak price of the head is at $0.08033 and the low point of of the shoulder is at $0.072711. The difference is $0.00762. It's this difference that will be subtracted from the neckline price to get the target. Now, subtracting this from we have: ($0.072711 – $0.00762 = $0.06509). Hence the target level or take profit is $0.06509
See the screenshot below.
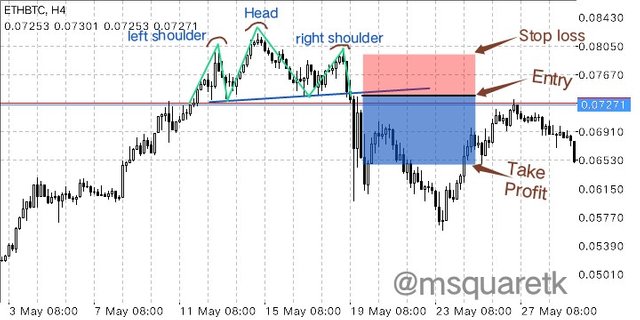
ETHBTC Demo Trade or Simulation showing entry and exit level | Screenshot from MT4 App
Explanation of Demo or Simulation Trade for Inverse head and shoulder pattern
Now, we have seen a simulation for head and shoulder pattern, let's see the inverse head and shoulder now. Firstly to use inverse head and shoulders strategy, the market must be in a bearish trend as we know that the pattern is found in a bearish.
Now the first thing to look for is that the inverse left shoulder should form in a bearish market. Once this form, the formation has started. Then wait for inverse head as well as inverse right shoulder.
Once the formation is complete, draw a neckline using trendline to join the high of the inverse left shoulder and the high of the inverse head created. Then, we will then wait for price to break the neckline to the upside.
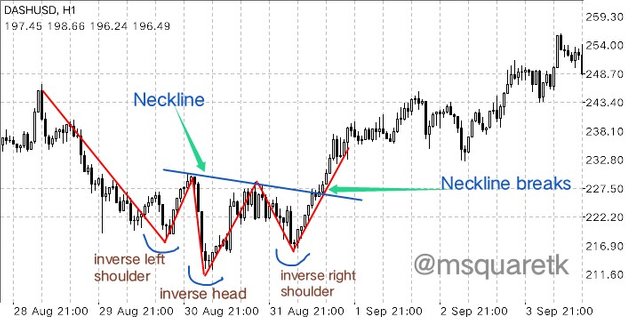
Trade Simulation using Inverse Head and shoulders pattern Strategy | Screenshot from MT4 App
Entry
To enter a trade using Inverse head and shoulders pattern, the neckline must break to the upside. A buy order is placed after the formation of the next candle that breaks the neckline. However, a safe trader will wait for the retest of the neckline.
Stop loss
Stop loss level is placed at the level price of the inverted right shoulder. This is the safest place. If price should come back to this area, that means the set up is invalid.
Target level or Take Profit
The take profit is calculated like this:
First measure the difference between the inverse head level and the high point of any the inverse shoulder
The difference we get is then added to the neckline price to get the target.
For my own, as you will see in the chart of DASHUSD. The price level of the inverse head is at $211.60 and the high point of the inverse shoulder is $227.50. Now the difference is $15.9. Now, to get the target, the difference is added to the neckline price, which is ($227.50 +15.9 = $242.4). So, therefore the target is $242.6.
See the screenshot below.
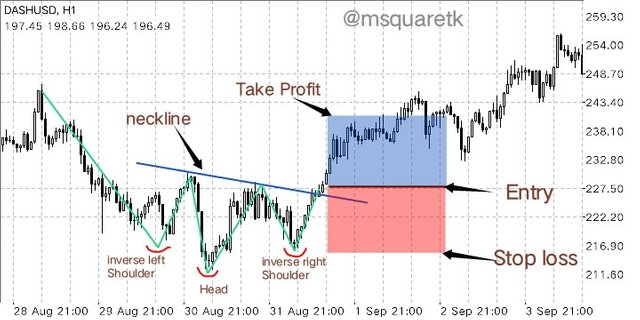
DASHUSD Trade Simulation showing entry and exit point | Screenshot from MT4 App
4. Place 1 real trade for Head and Shoulder(atleast $10) OR 1 trade for Inverse Head and Shoulder pattern(atleast $10) in your verified exchange account. Explain proper trading strategy and provide screenshots of price chart at the entry and at the end of trade also provide screenshot of trade details.(Screenshot needed.)
For this task, I am going to be using the chart of LUNAUSD. Opening this chart I saw market on a bearish trend. And we know that inverted or inverse head and shoulders pattern can be found in a bearish trend, at the bottom of that trend. So, I looked to see If the inverse left shoulder has formed which is the first thing that we must look for.
So, seeing that the inverse left and right shoulder and head have formed, I drew a trend line connecting the high of the inverse left shoulder and high which the Inverse head created. This is my neckline. So, the next thing is, we will wait for price to break the neckline. The price broke the neckline.
See the screenshot below.
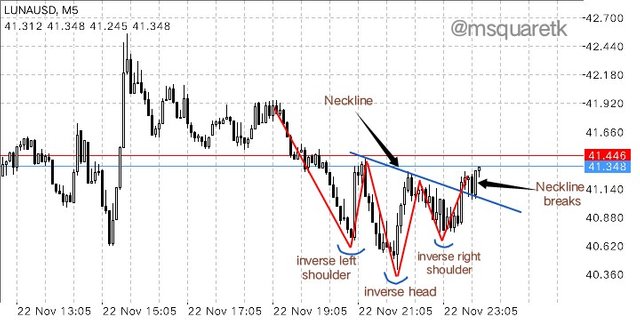
LUNAUSD Buy Trade Setup using inverse head and Shoulders | Screenshot from MT4 App
Then, since the price broke the neckline, the entry is the close of the next candle after the candle that broke the neckline. This is my entry. However, some traders can enter at the retest of the neckline. However, price doesn't retest all the time. My entry price is $41.34
I put stop loss at the price level of inverse right shoulder. The stop loss price is $40.72 So,if price should go and touch this level, then I will look for another setup.
Take profit was taken like this: I measured the lowest level price of the inverse head and the highest this low created. Then I found the difference. This difference is then added to the neckline price to get the target. See the screenshot below. The target is at $41.92
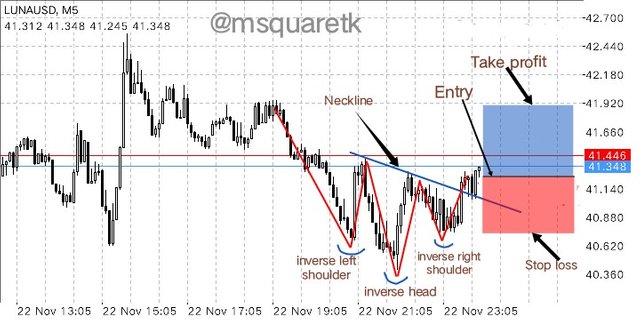
LUNAUSD Buy Trade showing TP, SL and Entry. | Screenshot from MT4 App
I entered an instant buy order execution on my binance verified account. I bought at market price of $41.34 and I bought LUNA worth of $12. See the screenshot below.
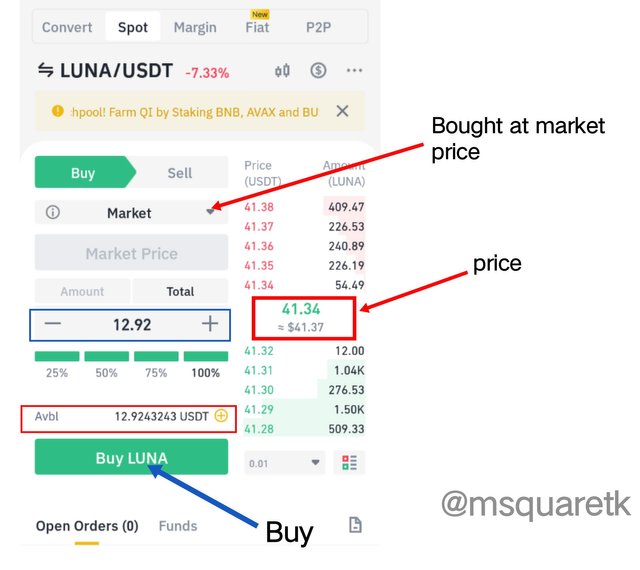
Placing Buy entry on LUNAUSD | Screenshot from My binance app
Below is the order details showing the trade, the time of the execution, the price I bought and many more.
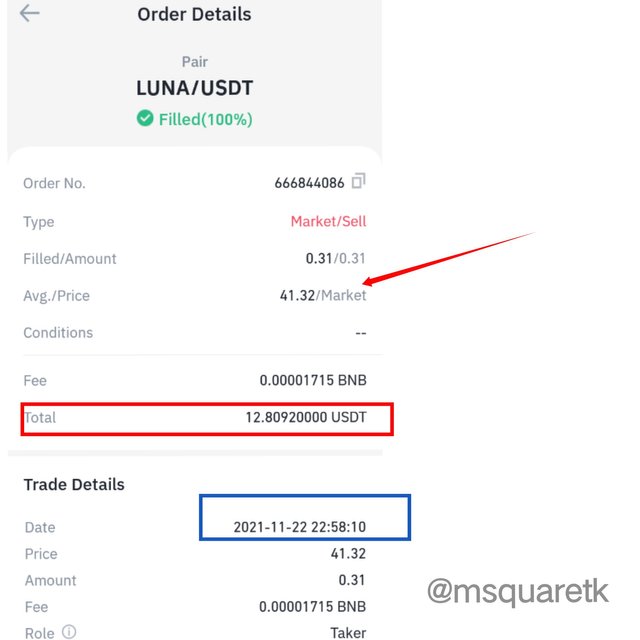
LUNAUSD order details | Screenshot from My binance app
Now, the trade was taken at night of 22nd of November, 2021. I had to leave the trade and see what will happen. So,I went to sleep. Behold the next morning, 23rd Nov., the price moved in the predicted direction but couldn't reach where the target was placed before turning to the downward direction. And the stop loss was hit. Oops! See the screenshot below.
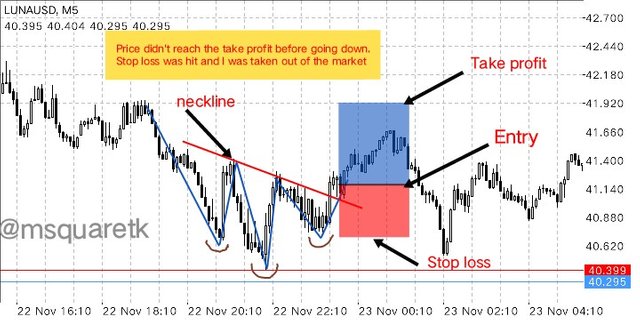
The Chart of LUNAUSDT showing the trade result | Screenshot from MT4 App
As it is seen in the screenshot above, the trade almost hit the take profit before it turned. So, I is recommended to trail the stop loss in case of things like this in the market. We are not the controller of price; we only have tools which can help us predict the direction to some extent the direction of price.
Conclusion
Chart patterns are one of the key technical tools for analysing the price of an asset. There are reversal trend pattern and continuation trend pattern. Head and shoulders and Inverse head and shoulders pattern are reversal pattern which are formed at the extreme bullish and bearish pattern.
Head and shoulders consists of three peaks: left shoulder, right shoulder and the head. While the inverse head and shoulder consists of inverse left shoulder, inverse head and inverse right shoulder. A sell entry is opened after the price breaks the neckline of the head and shoulder pattern, while a buy entry is opened when the price breaks the neckline of the inverse head and shoulders pattern.
Although these patterns can be found in anytime frame, but they are not easy to find. Also most traders like these patterns because of their reliability. Some traders say that the success rate is 82% while others say that it 85%. Whatever they percentage is, they are one of the surest chart patterns. Thanks to Professor @@@utsavsaxena11 for the teaching. I have learnt one or two things from these patterns as I was able to recognize and use it to place trade.
Note: All screenshots are taken from my MT4 app and binance app.
CC: @utsavsaxena11
Written by @msquaretk