Steemit Crypto Academy Season 3 Week 3 - Homework Post for @lenonmc21 [All About Trends, Supports and Resistances and Simple Chart Patterns]
Today I will try to do the homework given by professor @lenonmc21. Alright let's try.
Trends, trend lines and their role in charts
On the cryptocurrency chart, of course, we will see price fluctuations that occur at any time, we can see that price movements are increasing or decreasing, this is what is called a trend, so simply a trend is a price movement in one direction that can go up or down or commonly called an uptrend and downtrend.
Trends occur due to investor activity in the market, this activity affects the price of a cryptocurrency, and the price movement of an asset can be seen in charts available on the web such as coinmarketcap, coinecko, and tradingview. if there is an uptrend, it means that buyer activity is more dominant here which drives prices to continue to increase. whereas if there is a downtrend, the seller's activity is more dominant, thus pushing the price of an asset to decline.
Trend lines are lines that can help traders identify what trend is happening, such as an uptrend (bullish trend) or a downtrend (bearish trend). if there is an uptrend then this line connects the lowest point on a chart whereas if there is a downtrend then the line connects the highest point on a cryptocurrency chart.
so trend lines are very important on a cryptocurrency chart so that traders can know exactly what trend is going on. All of this can be used for early technical analysis regarding changes in price movements
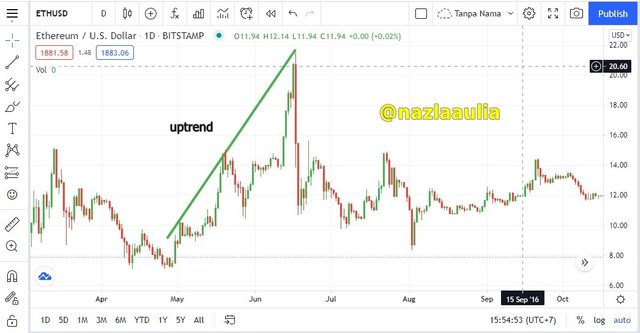
Uptrend line and a downtrend line
Before drawing an uptrend line, we must first understand the uptrend, so the most important thing to know is that the uptrend pattern is a chart pattern that is increasing upwards, then we must connect the lowest points on the increasing chart pattern For more details, we can see the image below.
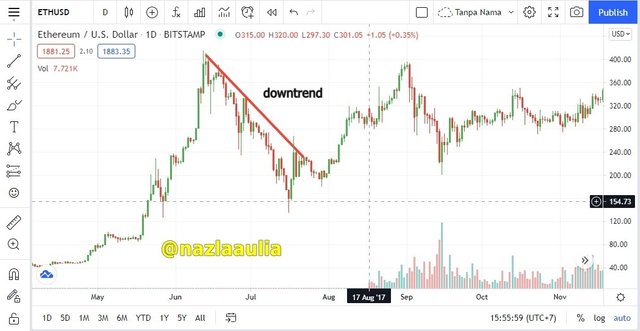
while in drawing a downtrend line, the most important thing to know is that the downtrend pattern is a downward trending chart pattern, so we must connect the highest points on the declining chart pattern. For more details, we can see the image below.
Supports and Resistances
support and resistance are reversals in the price of an asset. so at that time is the right time to enter the market or stop the market, for more details let us enter the discussion.
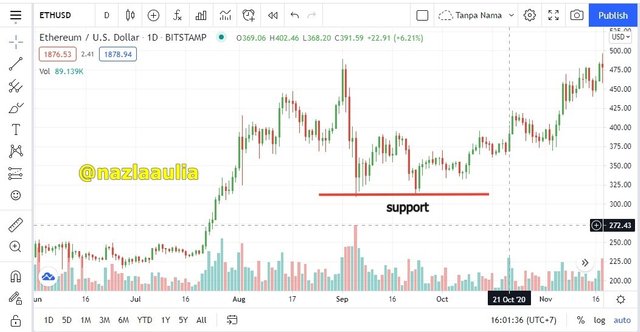
- Support
support is a zone when the price of a cryptocurrency changes from a decline to an increase, currently forming an angle on the chart that is below when the price of an asset reverses. so it can be said that the support phase is the right time to enter the market because asset prices will increase. For more details, we can see the graph below.
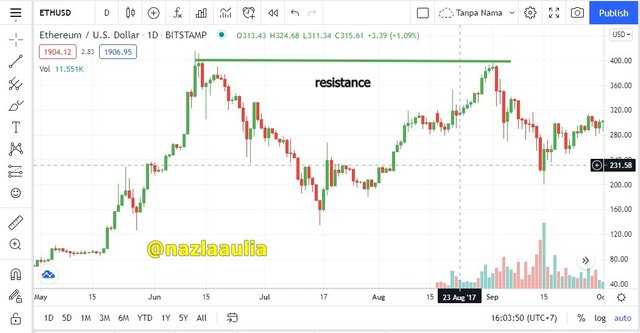
- Resistance
Resistance is a zone when the price of a cryptocurrency changes from an increase to a decrease, currently forming an angle on the chart above when the price of an asset reverses. so it can be said that the resistance phase is a good time to sell our assets to take profits because asset prices will decline. For more details, we can see the graph below.
Simple chart patterns
well I will try to explain 2 chart patterns that I took from tradingview while the chart I took was ETH/USD.
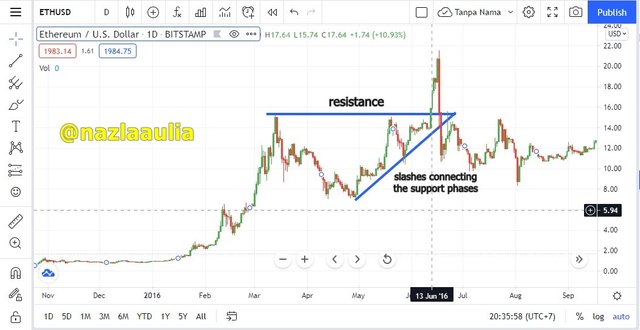
Ascending Triangle
Ascending Triangle is a support level that occurs continuously and the price of an asset has increased, this is all caused by the activity of buyers buying an asset so that it encourages an asset to increase. if we look at the chart it forms a higher slope pattern and can be drawn a sloping line connecting the support phase and then a straight line that determines the resistance level so that it is shaped like a triangle. For more details, we can see the image below.
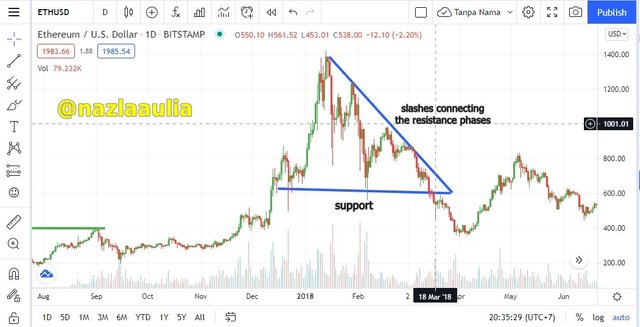
Descending Triangle
The descending triangle is a resistance level that occurs continuously and the price of an asset has decreased, this is all caused by the activity of sellers selling an asset to take profits, thus pushing an asset to decline. if we look at the chart it forms a lower slope pattern and we can draw a sloping line connecting the resistance phase and then a straight line that determines the support level so that it is shaped like a triangle. For more details, we can see the image below.
Conclusion
A trader certainly needs careful planning before starting trading. one of them is to understand graphic patterns in order to be able to know the price movements of cryptocurrencies on the market. By studying the uptrend, downtrend, support, and resistance and others, traders can find out basic information about technical analysis so that they can predict the next chart movement to make a profit.
Thanks....
CC : @lenonmc21