Steemit Crypto Academy Contest / S14W2 - Volatility in cryptocurrencies

Hello friends. Picture the following senecio
Ngoenyi went to the market to buy goods for resale, she buys at a certain price and while still at the market, she heard that the price of that goods she just bought has increased because the goods was going to be scarce. She is very happy that she bought those goods earlier than when the news was received. As it stands, she will sale those gods with huge profits. But suddenly, still within the same time, the price falls again as a result of the fact that all those who had bought that same goods and who have heard of the price increase came at the same time to dispose of those goods in order to make profits
Volatility can happen at any time can push the prices of goods or cryptos either upwards or downwards. What is volatility and how does it affect the crypto market? Let's figure it out friends. I invite @yanker @sahmie and @steemdoctor1 to also take part in this contest
What has taken place
In your own words, how does volatility affect cryptocurrencies? Is it beneficial or harmful?
We need to understand what volatility is first. Volatility can be explained as the frequency by which an assets price rises or falls. This is most at times caused by some positive or negative news in the market, or expected development surrounding the crypto asset.
Another reason that causes volatility is the presence of short sellers and trading robots in the crypto market.
It can also occur due to market psychological factors, where there is a instant movement of investors perception in the market.
The level of volatility is used to determine the returns of an asset over a given period of time. It also helps in ascertaining how risky a crypto asset is especially during trading. When volatility is high, the trading risk is also high, when it is low, the risk is low as well.
Volatility is usually of interest to traders since it gives them the opportunity to make a lot of profit while at the same time, they may incur significant losses in the process.
For some that knows the risk involved, they may decide to stay away from the market until price movement stabilizes.
So we can say that volatility affects the sentiment of traders.
Another thing volatility does is that it leads to high trading cost. Due to volatility, The spread of the crypto assets increases. Thus, the difference between the ask price and bid prices widens.
So traders pay more during price volatility of crypto assets.
Is it beneficial or harmful?
Well, whether is is beneficial or harmful is dependent on the individual trader. For those who take advantage of the volatility to make huge sums money as profit, it is very beneficial to them. On the other hand, for those who sustain huge losses during volatility period, it will be very harmful to them.
However, it is best for the price of a crypto asset to grow organically. This will bring about more investors confidence on the crypto assets.
But note that volatility is a part and parcel of the market. So it has come to stay whether beneficial or harmful.
Name and describe a technical indicator that measures the market volatility of an asset.
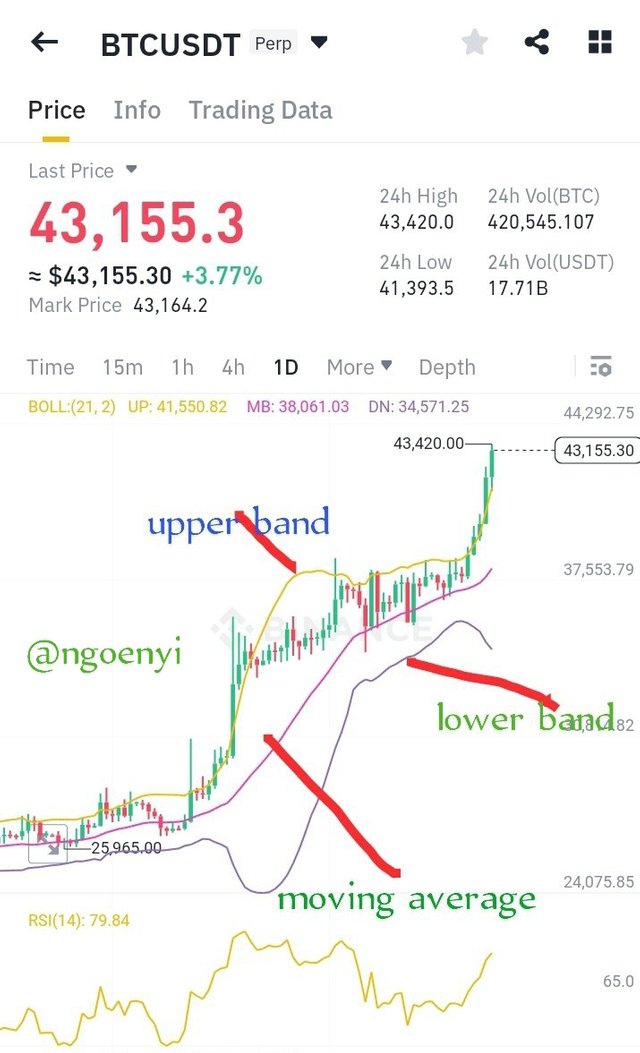
One of the technical indicators that measure the price volatility is the Bollinger band.
It is an indicator that defines the upper and lower level range of the price of an asset. This was developed by John Bollinger and the indicator was named after him.
It is ploted using a standard deviation level that is above and below the moving average of the price of the asset. Due to the fact that the lines or bands are calculated based on the standard deviation, they readily adjusts to volatility movement within the base price.
So from the explanation above, it makes use of two basic framework, the standard deviation and the period (length). However, a user can be able to adjust the length and the deviations to suit him.
 from my Binance app
During the period of low volatility, the bands tightens and are very close together. Once this is seen, it is a signal of a incoming price volatility towards any of the directions.
However, care muat be taken to avoid being deceived by false breakouts before it starts moving in the actual direction.
The unusual widening of the bands is an indication of high volatility and a signal that a particular directional movement may be coming to an end.
The two bands can be used as a profit taking point for traders and can also serve as a point for exiting the market.
When the price moves out of the band, it is an indication of a strong trend whether up or down. But when it quickly gets back to the band, it then signals a weakening trend or low volatility.
Describe the step-by-step to be able to include this indicator in the STEEM/USDT chart. You can use the Tradingview platform. Show screenshots.
To add the indicator on my steem/usdt chart, I will be using tradingview.com platform to show that.
Steps
We open out tradingview.com platform.
Select the pair of STEEM/USDT
Click on the fx sign to add the volatility
indicator
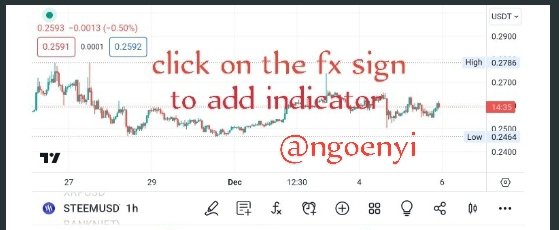
- On the search bar, type. bol for Bolinger and select the one indicated on.
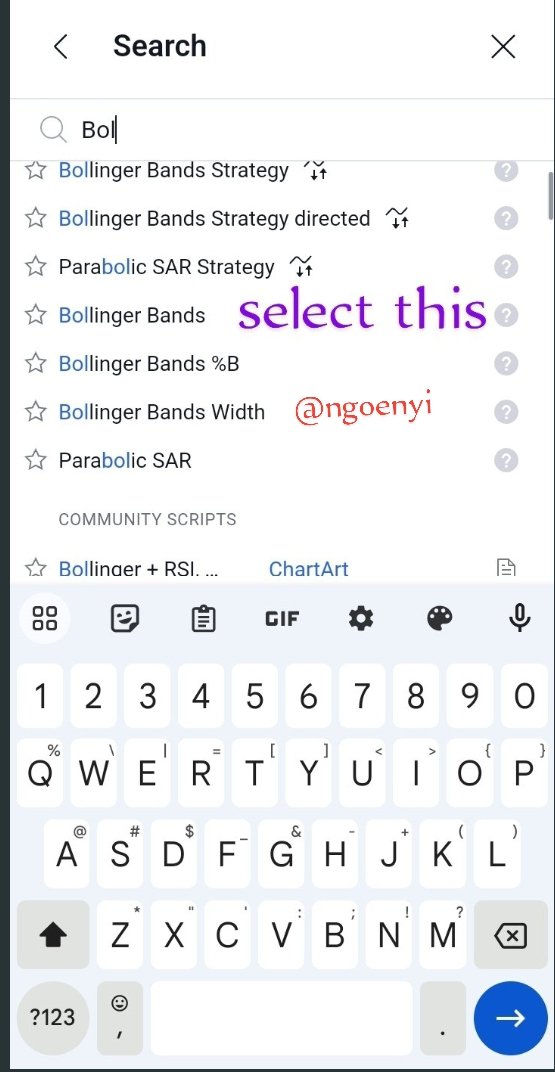
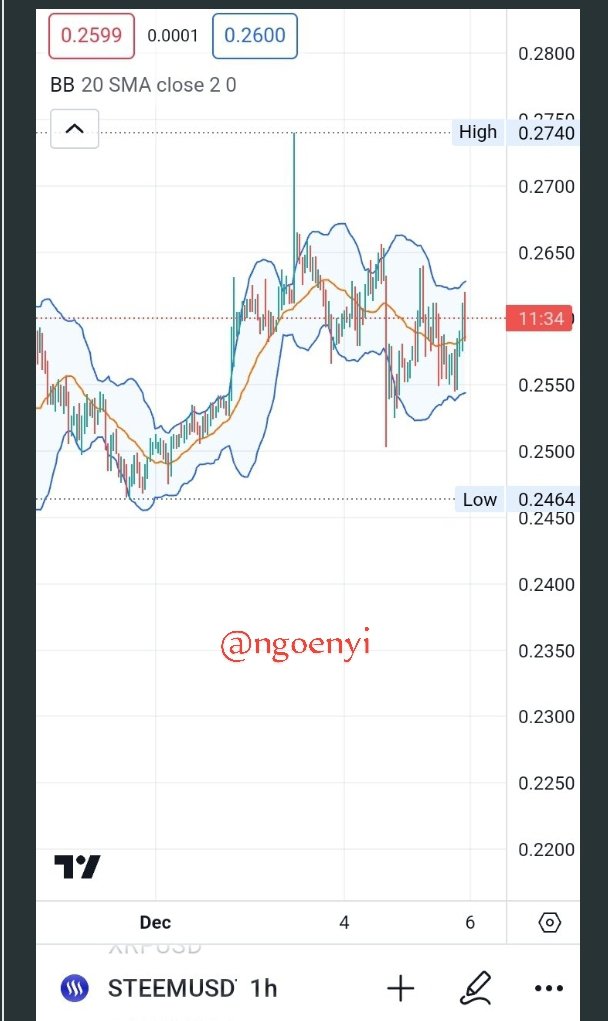
It then appears on our chart showing both the bands upper and lower including the Simple Moving Average (SMA).source
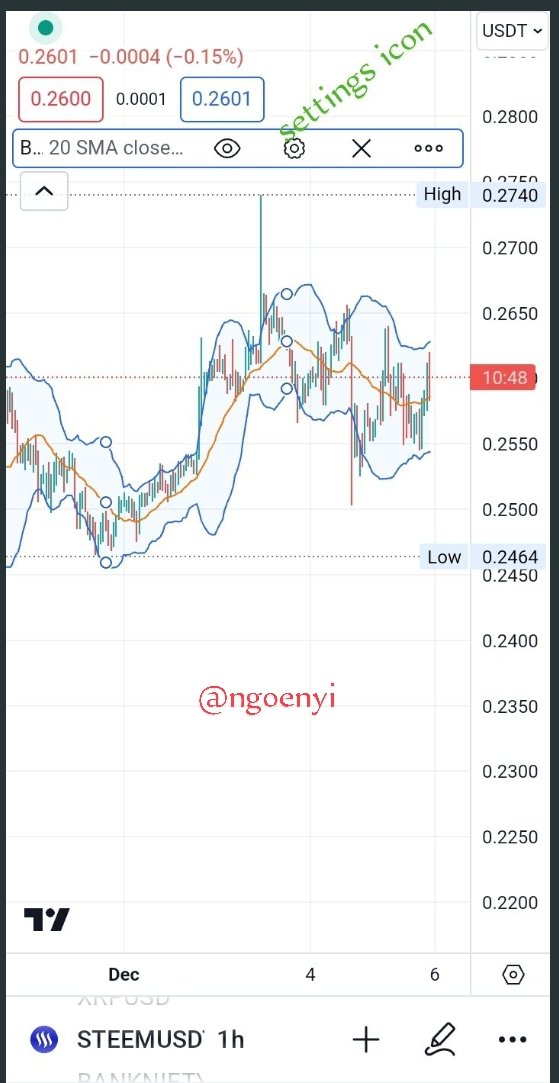
We can also adjust the deviations and the moving average period by clicking on the settings icon and adjusting as necessary.
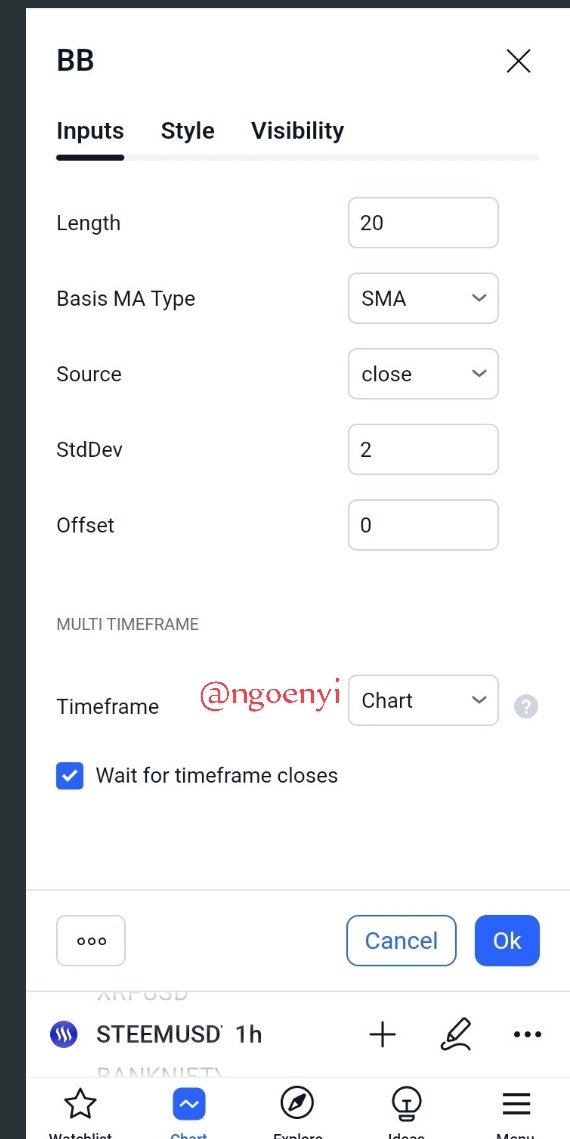
It will bring out a screen as shown below, we can adjust the input or values, style: which is about the colour representing the bands and the SMA and then the visibility - which time frames it should appear.
This is how to add the Bolinger indicator on the Steem/USDT chart.
Explain in your own words, what happened to the volatility in the last month of the STEEM/USDT chart.
During the month of November 2023, we saw a sudden surge In the price of Steem. We saw increased volatility in its price. This can be clearly see in the screenshot.
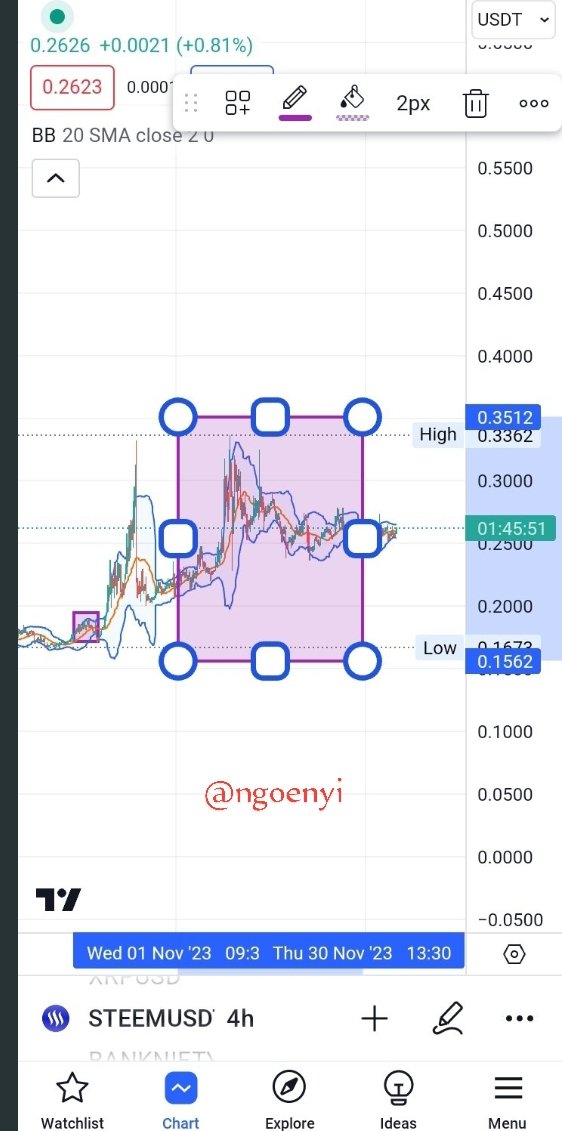
From the screenshot above, the area within the box is for the month of November 2023, we saw the widening of the Bolinger bands at a point where the price rose to 0.3322.
This volatility was caused by crypto news. The news was about steem coin being listed on some exchanges to be traded on their futures and spot market. It added so much liquidity to the steem coin market.
That was a period of intense volatility for the steem coin. It looks small because of the time frame, but on lower time-frames, it is very conspicuous.
After that intense volatility, it seems that the coin have been ranging since then, no wonder the Bolinger is contracted, waiting for a real trend direction to present itself.
Do you think the future of crypto currencies is more stable? Give your own opinion.
Crypto currency have come to stay. The future is very bright and with recent developments, there is no going back on it.
The recent event in the world crypto scene and the approval of some Bitcoin ETFs are all positive proofs that it's future is already embedded on stones.
Additionally,in so many places, it is being used and accepted as a legal tender and a medium of payment.
So I am of the opinion, the future is very bright and we are going to see that during this forthcoming bull run.
Conclusion
Volatility in the crypto market is a certainty. It is now left for individuals traders or investors to ascertain how to put it into good use to make huge profit, while being conscious to minimize their losses.
This is my introductory post here
Greetings ma,
It's really amazing how you've broken down a complex concept like volatility in a way that makes it easier to grasp. Understanding volatility is like having a superpower in the world of investing and market analysis as it helps users to make smarter decisions and navigate those ups and downs without issue. So, cheers and thank you for helping us understand it much better. It's awesome to have you simplify things and make it accessible.
Good luck in the contest, I say all the best ma.
Volatility is seen in everyday life but not as high as in cryptocurrencies. It is only left for the trader to make use of his strategies in a way that he will take advantage of it instead of recording losses here and there.
Superpower in deed! I wish we can all have it to apply when needed. Thank you for you kind words. I do learn from you too. I appreciate
TEAM BURN
Congratulations, your comment has been successfully curated by @kouba01 at 5%.
Volatility is also profitable is some ways because it create and opportunity for investors to enter the market. I like your explanation.
Thank you, you are very correct
--
☃❄🎄This is a manual curation from the @tipu Curation Project.☃❄🎄
Also your post was promoted on 🧵"X"🧵 by the account josluds
@tipu curate
Upvoted 👌 (Mana: 3/6) Get profit votes with @tipU :)
Saludos amiga, excelente explicación de como la volatilidad es parte del mundo de las criptomonedas, buena explicación en los gráficos de steem/usdt, las bandas de bollinger son un buen método para medir la velocidad de la volatilidad.
Éxitos amiga, bendiciones.
Thank you dear friend for engaging. I appreciate
https://twitter.com/Celina58042963/status/1732159480459112842?t=L0nNX9oWWs6_1KmTr6URQg&s=19
Your clear cut Explanation of volatility is adorable. Besides volatility, you have also highlighted the factors responsible for volatality in market.
Your explanation of bolingera bands is crystal clear and easy to understand even for new traders and that is because of your clear cut self understanding of the concept.
I respect your opinion of optimism about cryptos.
Good luck
Thank you dear for your wonderful comment, I appreciate
Your post has been successfully curated by @𝐢𝐫𝐚𝐰𝐚𝐧𝐝𝐞𝐝𝐲 at 35%.
Thanks for setting your post to 25% for @null.
We invite you to continue publishing quality content. In this way you could have the option of being selected in the weekly Top of our curation team.
Has tratado cada punto con sabiduría y dominio del tema. He aprendido mucho de tu contenido que puede servir de gran referencia para entender en pocas palabras.
Estoy de acuerdo que buena parte de la volatilidad en el mercado es causada por el ciclo de las emociones. El riesgo aumenta en la misma medida que aumenta la volatilidad, así que existen ganadores y también perdedores en un abrir y cerrar de ojos.
Las Bandas de Bollinger son un gran indicador no solo de la volatilidad sino de la tendencia. Cuando las bandas se alejan de la media aumenta la volatilidad y cuando se estrechan baja la volatilidad. Es el resultado matemático de un comportamiento alcista, bajista o estable.
Eres optimista en la estabilidad futura de las criptomonedas, esperemos a ver que pasa en este mundo tan impredecible. Nada se puede dar por contado.
Saludos y éxitos.
¡Un gran abrazo!
Hello ngoenyi.
You explanations on this concept are crystal clear and It is good that you have given a simple example in the starting of this post which will definitely help Steemians to understand about this concept more easily. Bollinger bands is great indicator and It can help a trader in technical analysis in various ways like in measuring the volatility of market or Sometimes, It's bands can also help in finding entry and exit points.
Great Post. Best of luck for the contest.