Advanced Technical Analysis Using Fractals || Steemit Crypto Academy | S5W8 | Homework Post for @reddileep

Again this is a very interesting and informative lecture on Fractals. It is also a trading technique that traders used while trading. This technique is based on a particular pattern that is made by price. I have learned a lot from this lecture. I try to answer the question according to my way. I hope it will help you to understand this fractal.

Define Fractals in your own words.
As we know that the market price fluctuates on the basis of demand, supply, buying, and selling. When the sellers dominate in the market then the price decrease on the contrary when buyers dominate the price increases. This increase and decrease in the price of an asset make different patterns on the chart.
There are several patterns that are made by price on the chart on the basis of price fluctuations like Wedge, rectangle, triangle, flag, double bottom, cup and handle and head and shoulder patterns. Traders use these patterns for making trading decisions.
The above patterns are repeated in the chart and traders use these patterns in trading. In the same way, the Fractals are the repeated pattern on the chart. The psychology behind the fractal patterns is that they repeat the same price behavior as it made before. Fractals are made of both bearish and bullish types according to the market scenario.
These are the repeated pattern on the chart. Traders use these repeated patterns for trading. Because they thought that the market again made the same pattern as it made before. This psychology is the same as the psychology of selling at the resistance level and buying at the support level.
There are several indicators and tools that help us to identify the fractal or repeated patterns on the chart. One of the well-known fractal indicators is Williams Fractal indicator that is used to identify the fractal in the market.
Explain major rules for identifying fractals. (Screenshots required)
There are several trading tools that operate on the basis of rules. If we do not follow the rules then we cannot get success in trading. In the same way, there are few rules to identify the fractal pattern. If all the rules are fulfilled by price action, then our fractal pattern is good for making decisions otherwise can face loss in trading.
- The number of candles should be greater than equal to 5 to identify the fractal pattern. If the number of candles is more than 5 then it shows the more precise results and vice versa. If the number of candles is less than 5, then it is not considered a fractal pattern.
- Based on the market condition, there are two types of fractals. One is bullish and the second is bearish fractal. After the formation of a bullish fractal, the market is expected to follow the bullish trend and after the bearish fractal, the market follows the bearish trend.
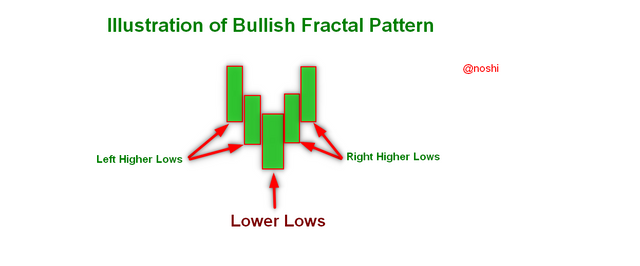
For the bullish fractal, the middle candles have the lowest low and at both sides of the middle candle, two candles have higher lows. You can see this in the following illustration.
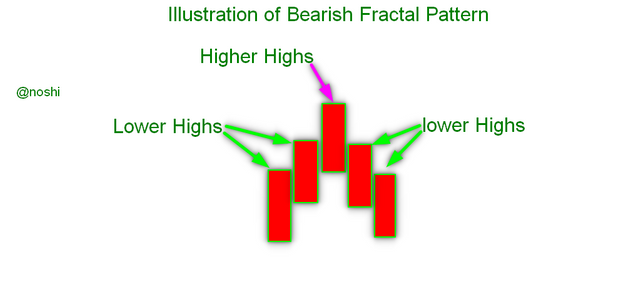
For the bullish fractal, the middle candles have the highest high and at both sides of the middle candle, two candles have lower highs. You can see this in the following illustration.
Reversal after Bearish Fractal ||Screenshot from TradingView
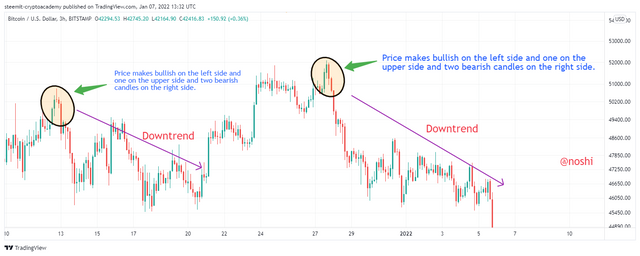
According to the above rules, figure out both bearish and bullish fractals. In the following figure, you can see that the bearish fractal is made. According to the rules, these patterns have middle candles that have the highest high and has two candles on both left and right sides that have lower highs. You can see that after the formation of a bearish fractal, the market is on a downtrend. In this way, we can identify bearish fractals for trading.
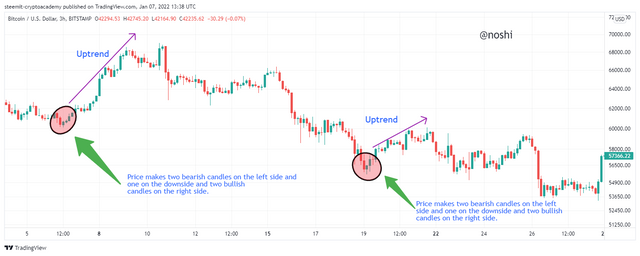
According to the above rules, I also figured out the bullish fractals. In the following figure, you can see that the bullish fractal is made. According to the rules, these patterns have a middle candle and have the lowest low, and has two candles on both left and right sides have higher lows. You can see that after the formation of a bullish fractal, the market is on an uptrend. In this way, we can identify bullish fractals for trading.
What are the different Indicators that we can use for identifying Fractals easily? (Screenshots required)
Fractals are identified on the basis of price data. There is no formula used in indicators to identify the fractals. Because fractals are the pattern that is only identified by price action. There are many major indicators that use the price action for the identification of fractals.
The William Fractal, Fractal Support and Resistance, and Fractal Breakout are the major indicator that helps us to identify the fractals. There are many other customized fractal indicators available but we will discuss these three indicators that help us to identify the fractal.
1. William Fractal Indicator
First, we discuss the William Fractal indicator. It is used to identify the fractals on the chart. First, we understand how to add this indicator to the chart. For adding this indicator to the chart, you need to do the following steps.
- Open the chart of any asset.
- Next, click on the fx indicator button on the top of the chart window.
- After that, write the name of the indicator as William Fractal.
- Then click on the first result that is appear on the chart.
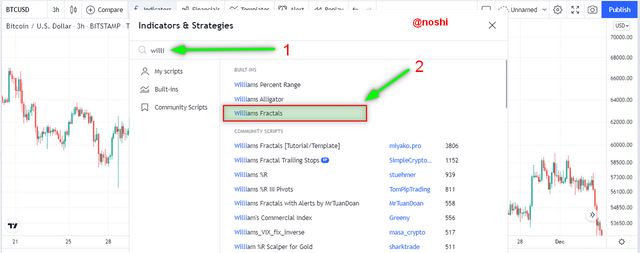
In this way, we can add The William fractal indicator to the chart. William Fractal indicator is used to identify the fractal patterns in the chart. Two types of fractal patterns are identified by this indicator. When the bearish fractal pattern is made by price then indicators indicate this bearish fractal pattern by making a little green triangle on the top of the bearish fractal pattern.
When the bullish fractal pattern is made by price then the indicator indicates this bullish fractal pattern by making a little red triangle on the top of a bearish fractal pattern. The bearish and bullish fractal pattern is made after the complete formation of the fractal by 5 candles.
When bullish fractal is identified by making the red triangle the indicator then it indicates the buy signal. On contrary, when a bearish fractal is identified by the formation of a green candle then it indicates the sell signal produced.
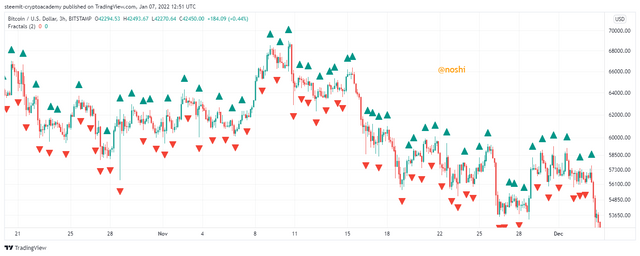
In the above figure, you can see that the William fractal indicator is applied on the chart. You can see that there are several places that indicator mark as fractals. The red triangles on the bottom of price action indicate the bullish fractals and the green triangle at the top of price action indicates the bearish fractals.

2. Fractal Support and Resistance Indicator
This is another indicator that is used to identify the fractal in the market. The fractal support and resistance indicator identify the fractal by combining the fractals by drawing the dotted support and resistance lines. The support and resistances also indicate the area where the market can take reversal due to buying and selling pressure.
Fractal support and resistance connect automatically support and resistances by drawing the dotted horizontal lines. Every trader who has the psychology in which they thought that the market take reversal after touches in the support and resistance level then this indicator is very helpful for them.
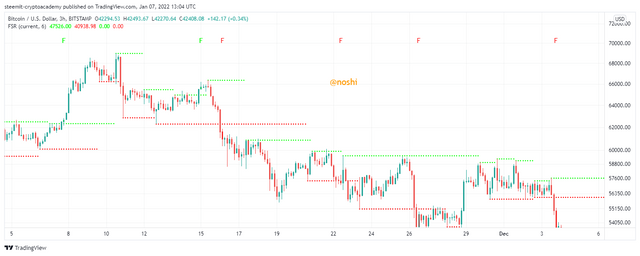
We can add this indicator to our chart same as we add William Fractal. We just change the name by Fractal Support and Resistance and then select the relevant result from the search. In the above figure, you can see that the fractal support and resistance indicator is applied on the chart.
You can see that all the bearish and bullish fractals are attached by dotted horizontal support and resistance lines. This line indicates the support and resistance level where the price can take reversal after touching the support and resistance. We can use this indicator for making trading decisions on the basis of support and resistance.
3. Fractal Breakout Strategy
This is another indicator that is used to identify fractals. It is a colorful indicator that indicates the signals in multiple ways. It is comprised of two lines with color different colors. The blue line indicates the bearish fractals and the red line indicates the bullish fractals.
In this indicator, the bullish and bearish fractal signals are produced by breakout the line to the price action candles. When the blue line crosses the candle, it indicates the buy signal and when the red line crosses the price action, it indicates the sell signal.
Here is another way, of identifying the breakout or fractal signal is the background color of this indicator. When the color turned to green, it indicated the buy signal. The green background color also indicates the bearish fractal. When the color becomes green the buy signal is also produced by the little blue arrow and tag under the arrow as Long.
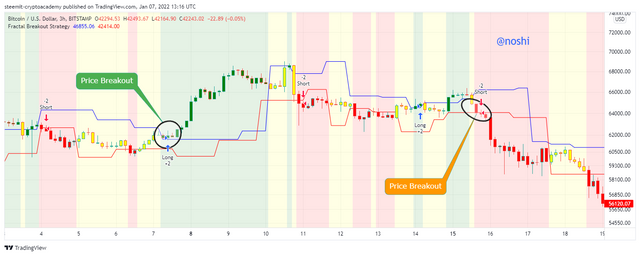
On contrary, when the color turned to red, it indicated the sell signal. The red background color also indicates the bullish fractal. When the background color becomes red, the sell signal is also produced by the little red arrow and tag underneath the arrow as Short.
We can add this indicator the same as we add other indicators. We just need to change the name of this indicator as Fractal Breakout Strategy. In the above figure, you can see the fractal breakout strategy indicator. I mentioned both breakouts in the chart. After the breakout, the price goes in both upward and downward directions.
Graphically explore Fractals through charts. (Screenshots required)
In this, we will explore the fractal on the basis of our own observation. As we discuss in the above questions that the fractal is repeating patterns on the chart. In the previous question, we figured out the fractal by using different indicators. But in this question, we will see how we can identify the fractals manually.
In this, we observed patterns on the chart and select the particular pattern. After selection, we compare the selected pattern with the recent pattern. Now we check the similarity between the current pattern and the selected pattern. If they are matched then make a decision on the basis of the previous pattern. We expect that the market will behave the same as it behaves in the previous pattern.
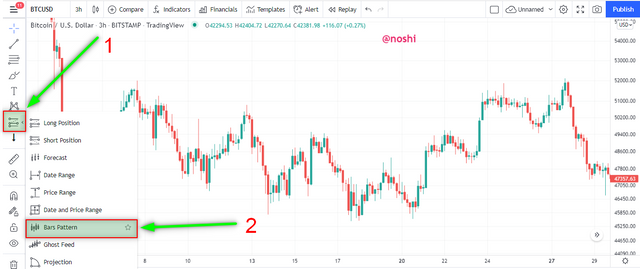
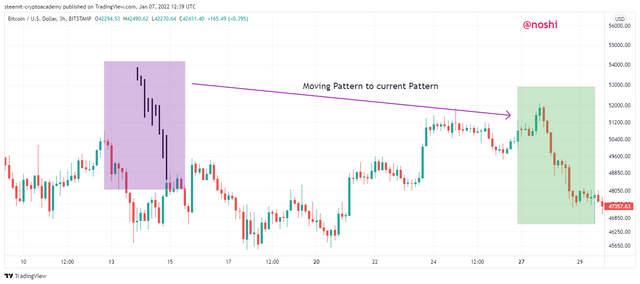
For exploring the fractals on the chart, I chose tradingview.com for the opening chart. First, I open the chart. For selecting the previous pattern we need to select the tools from the toolbar name Bar Patterns. For selecting this tool, you need to go on the toolbar at the left side of the chart and click on the mentioned area, and then select the Bar pattern option.
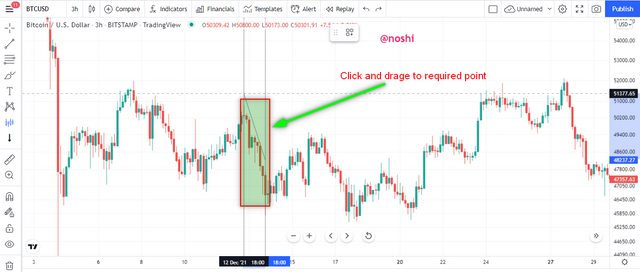
After that, we need to select the area of the pattern by just clicking on the point where we want to start and dragging it where we want to copy the pattern. In the following figure, you can see that I click on the chart and drag it to the required place.
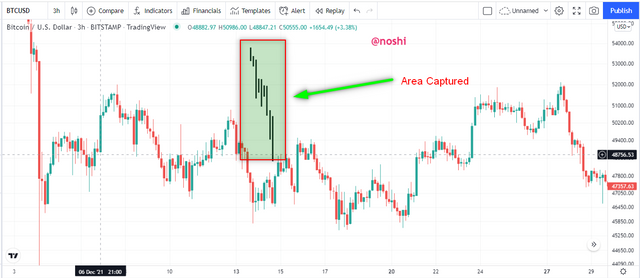
In this way, a copy of the selected pattern is generated. Now we need to move this copied pattern to the current pattern. We need to compare the selected pattern with the current pattern. For this, we need to place the copied pattern over the current pattern. I do this by dragging and dropping to the required position.
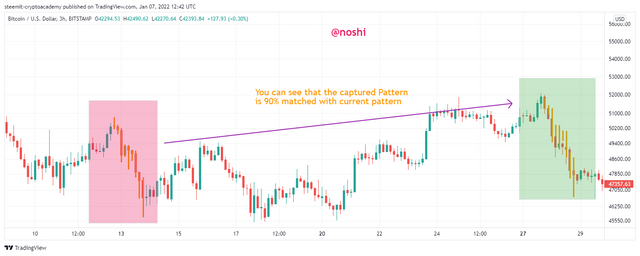
You can see that our pattern is 90% matched with the previous pattern. In this way, we can easily find the fractal manually. This is the bullish fractal that we find manually. After bullish fractal, the price is going down. So, we can make a decision after comparing the patterns.
We need to be very careful before making trading decisions while doing trading with fractals. Sometimes the market does not move according to our expectations. So, we need to do proper confluence analyses using different indicators. By doing technical analyses using the confluence trading strategy, we can reduce the risk.
Do a better Technical Analysis identifying Fractals and make a real purchase of a coin at a suitable entry point. Then sell that purchased coin before the next resistance line. Here you can use any other suitable indicator to find the correct entry point in addition to the fractal.
For doing better technical analyses, I use another indicator with a fractal indicator for confirmation of signals. Moving Average is a good indicator that we should use as a confirmation tool with fractal indicators.
I chose DASH/USDT pair for trading doing technical analyses. First, I open the chart of that asset and apply the fractal and moving average indicators on the chart. First of all, I am looking for a buying opportunity. I find the buying opportunity through the buy signal given by fractal indicator and confirmation signal by Moving Average. I set the chart to 5 minutes and use the 9 periods Moving average.
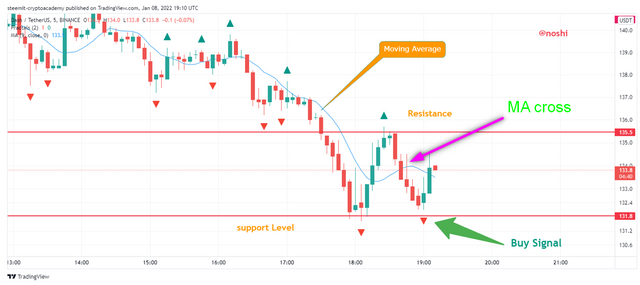
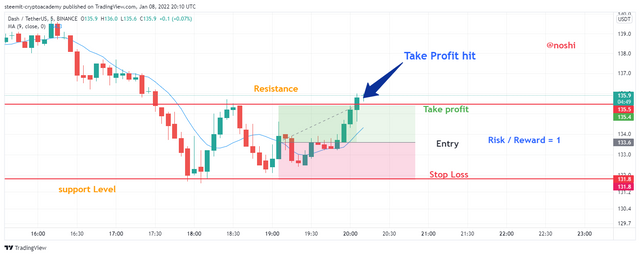
In the above figure, you can see that the Fractal indicator shows a red triangle or buy signal after the formation of fractal by price action. Moving Average is also cross the price candle as you can see in the figure. When MA crosses the candle from top to bottom, it indicates the buy signal.
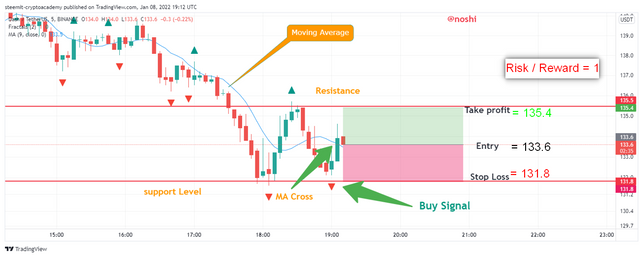
So, I place the buy order after confirmation of the signal. I also set the stop loss and take profit limit after observing the support and resistance level. All the data about my trade is mentioned in the following.
Entry Price = 133.6
Stop Loss = 131.8
Take profit = 135.4
Risk / Reward= 1
Here you can see my buy order details. I place real buy trade on Huobi Exchange. According to the Entry price, the buy order is filled exactly on 133.6.
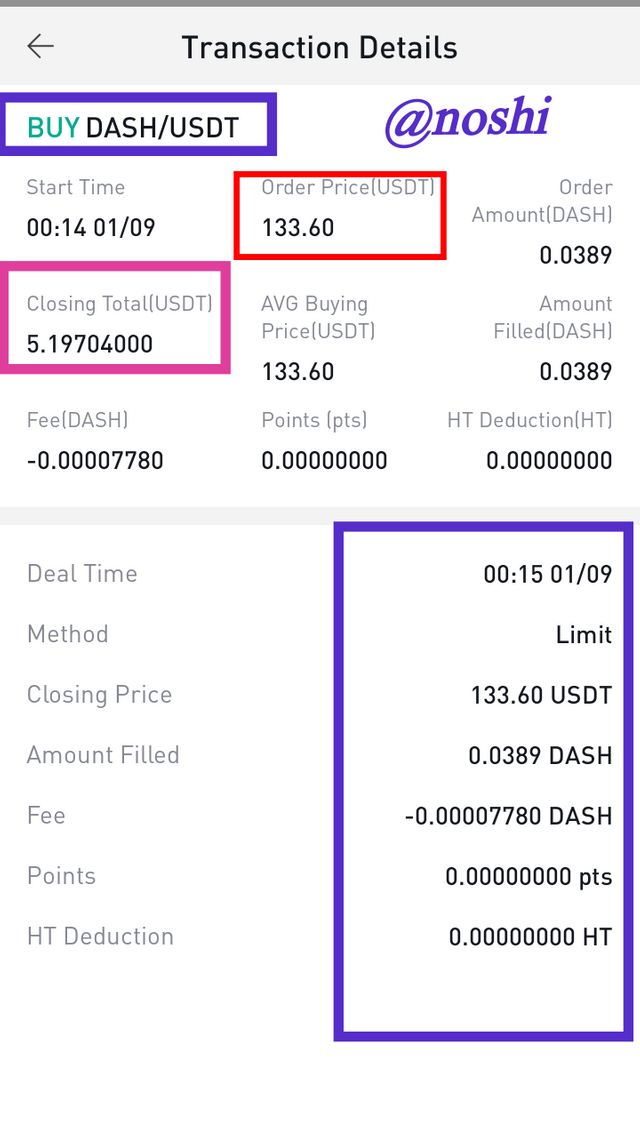
After waiting a while buy Take profit limit is hit and my sell order is executed. In the following figure, you can see that my take profit level is hit by price. In this way, making a profit from this trade.
Here are the details of my sell order orders.
.png)
In this way, we can trade using the fractal indicator.
Fractal patterns are repeated patterns in the market. Traders use these patterns for making decisions according to the previous behavior of the market. Fractal patterns are linked with psychology. It is the same as every trader who sells at the resistance level and buys at the support level.
There are several indicators that are used to identify fractals. These indicators use only the price data of the previous five candles to generate the fractal signal. There is no additional calculation formula is including. Traders use this strategy for making trading decisions.
We can identify fractal patterns manually by using the bar pattern tool. We just copy the pattern and compare it with the recent pattern by just placing the copied pattern over the recent pattern. There is another indicator that we should use with fractal indicators is the Alligator indicator.
Hello @noshi,
Thank you for participating in the 8th Week Crypto Course in its 5th season and for your efforts to complete the suggested tasks, you deserve a Total|10/10 rating, according to the following scale:
My review :
Work with excellent content, because you have taken every question seriously, allowing you to get answers that are precise and in-depth in its analysis and clear in its methodology.
You have demonstrated a good understanding of fractals as a trading tool for cryptocurrencies based on your own words.
In the second question you have provided clear screenshots to explain the main rules.
In the third question you have done a good job on which you have discovered several indicators with which you can easily identify fractals.
In the fourth question, a good answer in which you provided clear graphics that allowed us to understand the exploration of fractals graphically.
In the fifth question, you have passed a good technical analysis to identify fractals and was followed by an actual purchase of a currency at an appropriate entry point, clearly mentioning several details of different signals such as levels support and resistance, as well as deviant entry and exit points.
Thanks again for your effort, and we look forward to reading your next work.
Sincerely,@kouba01
Thank You Professor for such a kind response 😊.