Identification of Rectangle Patterns || Crypto Academy / S5W4 - Homework Post for @sachin08
This is very informative lecture on patterns. In the previous class, we have discussed triangle patterns and flag patterns. In this lecture, professor discussed about the rectangle patterns. Rectangle patter is also helpful in trading to get entry and exit points. We will discuss the use-cases and its structure in the following question.

Explain Rectangle Pattern in your own word.
As we know that, the market price is not stable. It increased and decrease depending on the number of buyers and sellers entering and exiting in market. This is why market prices draw different structures on the chart. Few of the structures we have discussed in the previous lecture like triangle structure or pattern and flag pattern.
Rectangle patterns are also made by the price of assets. These patterns create an opportunity for traders to buy and sell. Because, most of the time when price breaks the structure of rectangle pattern, it will go upward and downward directions.
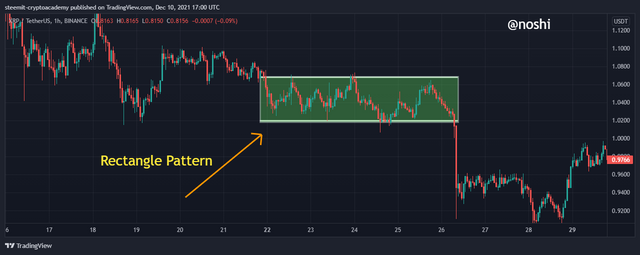
In a rectangle pattern, the price makes highs and lows approximately in equal height. When we draw a flat trendline on top of highs and one trendline on the bottom of lows.
All highs of price touch the top trendline and all lows of price touch the bottom trendline. In this way, the rectangle pattern is made. In the following figure, you can check what how the rectangle pattern looks like.
When price breaks the rectangle structure in either direction, the point of breaking the structure is known as a breakout. Traders use this breakout to take an entry and exit from the market.
How to identify Rectangles. Explain with Screenshots.
Identification of rectangle patterns is not so difficult. The rectangle pattern is easy to identify. In this pattern, there are a few things that we need to consider to confirm that it is a rectangle pattern.
The first thing that we should notice is price movement. When the price is making little ups and down within the specific region. Next, we draw a trendline on both up and downside. The price movement should be in between both up and bottom trendlines. Next, is the price highs and lows, in a rectangle pattern at least two highs should be touch to upper trendline and two lows should be touch to bottom trendline line.
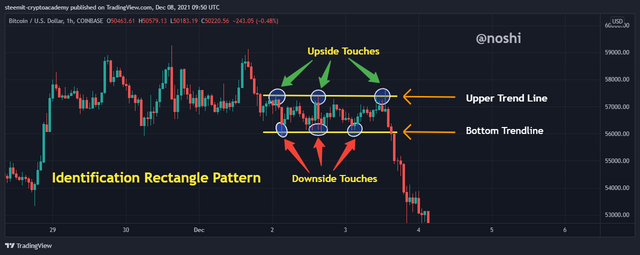
When these, conditions are satisfied, then we can say that it is a rectangle pattern. Rectangle pattern is made on both uptrend and downtrend. In the above figure, you can notice that I found a rectangle pattern. In this pattern, all the conditions are satisfied that are compulsory for rectangle patterns.
Can we use indicators with this pattern to get accurate results? Explain with Screenshots.
As we know that, these patterns are not a hundred percent sure for trading. Sometimes the price of assets does not behave as we expected from the market. This is why it is advisable to use one or more indicators with these patterns to get find results and confirm the signals.
In this question, I chose the Aroon Indicator for confirmation and getting the find signals. Aroon Indicator is comprised of two lines (Aroon-Up & Aroon-Down) that oscillates up and down and make crossovers. These crossovers are the signals of buy and sell. We will use these crossovers for confirming the breakout of the triangle.
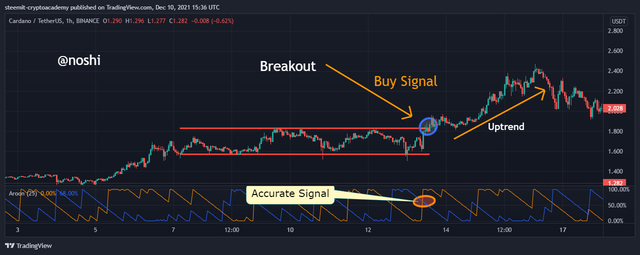
When Aroon-Up crosses the Aroon Down from bottom to upward direction then it is a buy signal from the Aroon indicator. On contrary, when Aroon-Up crosses the Aroon Down from upward to bottom direction then it is Sell signal from the Aroon indicator. We relate this crossover with rectangle breakout in the following figure.
Confirm Buy Signal with Indicator
In the above figure, you can see that the price of assets is on a downtrend and making the rectangle pattern on the bottom side. We can see that the price breaks the pattern as mentioned in the figure. At the same time, we should notice the Aroon indicator cross. We notice the crossover that indicates the buy signal and it confirms that the price breakout is true, we can take an entry to the market.

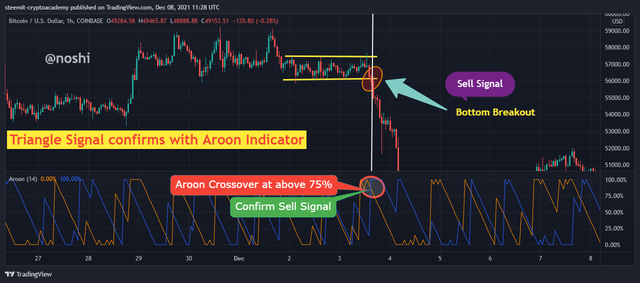
Confirm Sell Signal with Indicator
In the above figure, you can see that the price of assets is on an uptrend and making the rectangle pattern at the top. We can see that the price breaks the pattern from top to down as mentioned in the figure. At the same time, we should notice the Aroon indicator crossover. We notice the crossover that indicates the Sell signal and it confirms that the price breakout is true, we can take an exit from the market.
Explain Rectangle Tops and Rectangle Bottoms in your own words with Screenshots of both patterns.
Most of the time, the rectangle patterns are made after uptrend and downtrend. Basically, there are two types of rectangle patterns. One is the top rectangle pattern and the second is the bottom rectangle pattern. We will discuss both patterns in the following.
Top Rectangle Pattern
When the price of an asset is on an uptrend or at a peak then the price makes little highs and lows within the flat horizontal trendlines then we call it the top rectangle. When this rectangle is made after a recent uptrend, then it is a signal that the market is ready to go down.
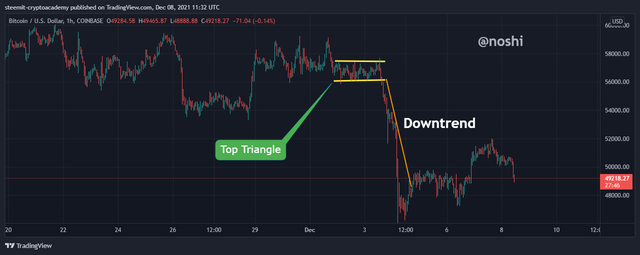
It is not a hundred percent sure but it is expected that the market can go down from here. In the above figure, you can see that the rectangle pattern is made after an uptrend. When the price breaks the rectangle, then the price is going down as you can see in the above figure.
Bottom Rectangle Pattern
When the price of an asset is on a downtrend or at a low then the price makes little highs and lows within the flat horizontal trendlines then we call it bottom rectangle. When this rectangle is made after a recent downtrend, then it is a signal that the market is ready for an uptrend.
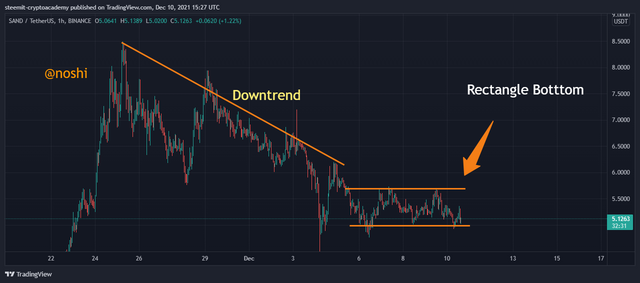
It is not a hundred percent sure that the market will surely go up but it is expected that the market can go up from here. In the above figure, you can see that the rectangle pattern is made after down. When the price breaks the rectangle, then the price is going up as you can see in the above figure.
Show full trade setup using this pattern for both trends. ( Entry Point, Take Profit, Stop Loss, Breakout)
In the above question, we have discussed that these patterns are used by traders to take an entry and exit from the market. In the question, I will mention the full trading setup with a rectangle pattern. We will set both buy and sell trade setups with proper taring management.
Buy Setup
I chose ADA/USDT pair for setting the buy trade. First of all, we need to find out the rectangle pattern that is made at the bottom. Because when the rectangle pattern is made at the bottom then the price will up after bullish breakout.
In the following figure, you can see that the price of ADA makes a rectangle pattern at the bottom. The Aroon indicator is used to confirm the buy signal. We can see that when the price of an asset breaks the structure of the rectangle, at the same time the Aroon indicator made a crossover that indicates the buy signal.
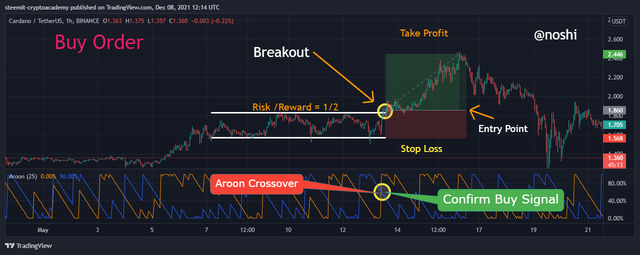
It means that the buy signal is true. So, I place the Buy order at slightly up the breakout with the stop loss and take profit level. The stop loss and take profit depend on the risk and reward ratio. It depends on your trading strategy, style, and how much risk that you want to take.
Entry Price = $1.860
Stop Loss= $ 1.568
Take Profit= $2.446
Risk/ Reward = ½
In this way, I place buy orders by using the rectangle pattern with the Aroon indicator.
Sell Setup
I chose XRP/USDT pair for setting the Sell trade. First of all, we need to find out the rectangle pattern that is made at the top after the uptrend. Because when the rectangle patter is made at the top then the price will up after a bearish breakout.
In the following figure, you can see that the price of XRP makes a rectangle pattern at the top. The Aroon indicator is used to confirm the sell signal. We can see that, when the price of the asset breaks the structure of the rectangle to the downward direction, at the same time the Aroon indicator made a crossover that indicates the sell signal.
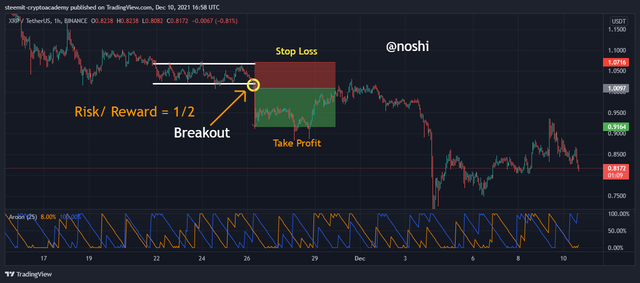
It means that the sell signal is true. So, I place the sell order at the slight downside of the breakout with the stop loss and take profit level. The stop loss and take profit depend on the risk and reward ratio. It depends on your trading strategy, style, and how much risk that you want to take. I place a sell order with the following parameters.
Entry Price = $1.0097
Stop Loss= $ 1.0716
Take Profit= $0.9164
Risk/ Reward = ½
In this way, I place a Sell order by using the rectangle pattern with the Aroon indicator.
Patterns are very important in trading. We can gain high profit if we place our trade right by using these patterns. Rectangle pattern is also very important. Rectangle pattern helps the trader to find out the exit and entry point. We should rectangle pattern for trading with the conjunction of one or more indicators for confirming the signals.