[Leverage With Derivatives Trading Using 5 Min Chart ]-Steemit Crypto Academy | S6W1 | Homework Post for @reddileep
source
Another season of the crypto academy is upon us, and the excitement to learn again this season is on the edge. After going through the intensive and educating lecture provided by the professor @reddileep, I decided to provide answers to the questions asked based on the acquired knowledge. I hope you enjoy reading this post as well as learn from it, so without wasting any time, I will begin with the assignment.

Introduce Leverage Trading in your own words.

There are skilled traders who have great knowledge of trading but lack the capital to enjoy the profit associated with their knowledge. Trading with little capital alone would generate profit on a very good trading day, but not the desired profit, since they aren't hedge fund companies that have excessive dollars in their account. With this, leverage trading has made a lot of traders make their desired profit even with their little capital.
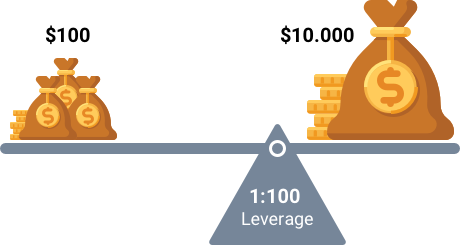
Leverage trading provides traders the opportunity to trade with more capital than they have through borrowing funds from their brokers to increase their trading power over the period of the trade. With leverage trading, traders can increase the size of their trade depending on the maximum leverage that the broker can give. Some brokers give 10x while others can give up to 150x. With leverage trading, traders can trade up to 100x greater than their capital as a result of increased trading power.
“When you combine ignorance and leverage, you get some pretty interesting results.” Warren Buffett
While leverage may be an outstanding tool in the hands of some traders, it could also be a tool of destruction in the hands of other traders. The difference between the result obtained from trading is associated with the skill and experience of the trader. For some traders who believe that leverage trading is an opportunity to make fast wealth within the shortest time, they end up liquidating, which means they are unable to take advantage of the profit that comes with the trading tool and at the same time, they lose the trading capital they owned initially. A very important skill to take note of during leverage trading is being able to study and understand market behaviour.
What are the benefits of Leverage Trading?
Traders have the opportunity to access additional funds from their broker, this way the trader will have an upper hand at making more profit compared to when the trader trades with their funds.
Traders do not need to get scared about accruing debt when there is a loss, and this is because the borrowing is spontaneous.
Traders tend to enjoy a multiplied profit if the trade goes well at the end. Traders also can enjoy multiple diversified profit from trading as a result of having higher trading power to trade different trades.
Leverage trading has basic trading techniques which make it convenient for traders to make a profit from the market and exit as quickly as possible (safe trading).
What are the disadvantages of leverage trading? .
Everything that has advantages must have associated disadvantages, the case is not different with leverage trading.
The same manner with which leverage provides you with an amplified increase in capital is the same way you can lose everything you have acquired within the slightest market change. Traders can lose all owned funds with one trading mistake due to using high leverage. This has cost a lot of traders their entire wealth and in some cases, their life.
There is a charged amount (fees) for borrowing funds to traders, unlike spot trading where traders are not charged for borrowing since they trade with their on funds.
- Traders can completely go into liquidation (i.e) the act of losing all invested funds once the market moves in an unexpected manner.
What are the Basic Indicators that we can use for Leverage Trading? (Need brief details for any essential indicators and their purposes).
Trading indicators are essential for traders because it helps them easily predict previous trends and future moves without stress. Basic indicators that every trader needs to utilize while trading are: Moving Averages (MA), Relative strength index (RSI), Moving Average Convergence Divergence (MACD), and On-Balance Volume (OBV).
Moving Averages (MA).
The use of Moving Averages as an indicator while trading, eliminates the presence of price fluctuations and constantly updates average price, on a chart, it is displayed as a straight line as every form of price fluctuations and variations have been eliminated.
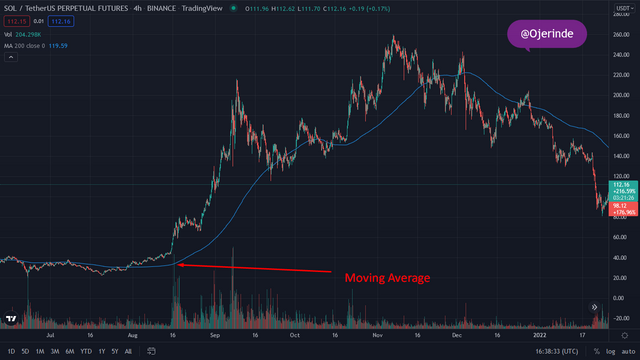
M.A is a good trade indicator that helps traders easily identify the presence of an uptrend or a downtrend within a given period. When a chart is drawn above the MA, there is believed to be an uptrend, if the chart, on the other hand, is drawn below the M.A there is an indication of a downtrend if it happens that the chart indicates a sideways trend giving no particular movement direction, then it is believed that the chart is a sideways chart having no particular direction.
Moving Averages can also be a source of price support and resistance, helping traders figure out a point of buy and sell. A buy signal can be detected when the price goes above a moving Average
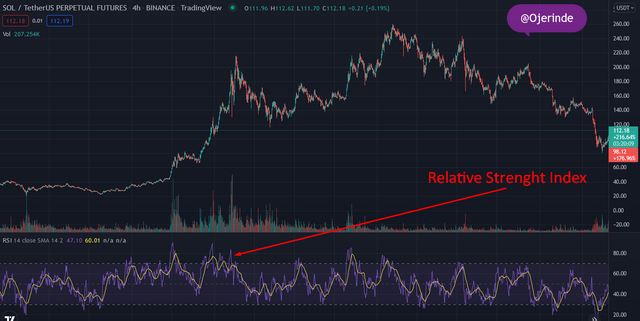
Relative Strength Index (RSI).
RSI is an oscillating indicator that has a movement within 0-100. RSI indicates overbought and oversold situations, providing traders with a view of when to buy and sell appropriately. When the price goes up to 70 and stays at that point for a long period, it indicates oversold conditions, overbought conditions on the other hand are indicated when the price goes below 30.
When RSI indicates an oversold condition, there is a great possibility of having a market reversal to give us an uptrend. Similarly, the indication of an overbought condition could result in a market reversal to give us a downtrend.
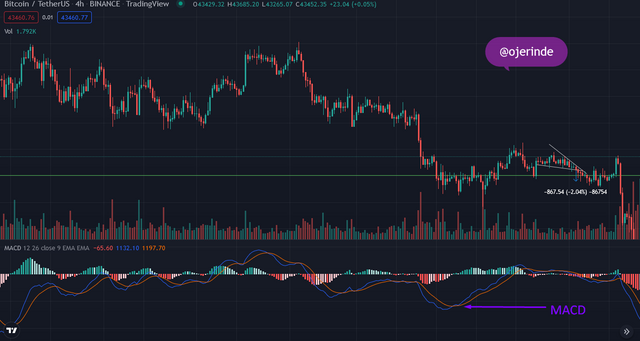
Moving Average Convergence and Divergence (MACD).
MACD functions as both a trend indicator and a momentum indicator, it is an oscillator indicator with a band therefore it is not visible in a chart, it is rather displayed as a default below a chart where it fluctuates above and below point zero. When MACD lines are displayed above zero for a period of time, it indicates the possibility of a downtrend, on the other hand, the display of MACD lines below point zero for a period of time indicates the possibility of having an uptrend.
MACD is made up of two lines: There is a blue line and a signal line, when a signal line which is usually yellow in color is drawn above the MACD line, it indicates a sell signal similarly when the signal line is drawn below the MACD line, it indicates a buy signal.
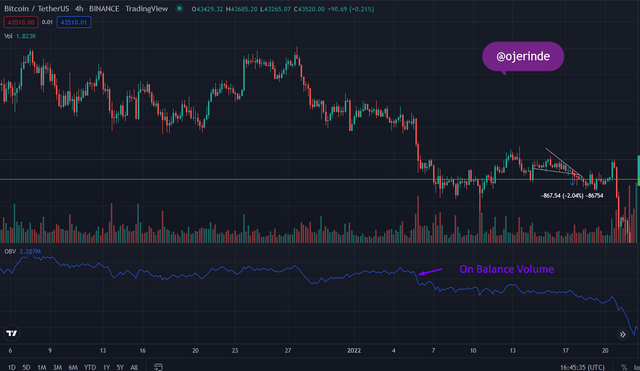
On-Balance Volume (OBV).
OBV as a trade indicator consists of a valuable amount of information compiled into a single line. A rise in price is accompanied by a rising OBV, a falling price is also accompanied by a falling OBV. In a situation where there is a rising OBV and price isn't rising instantly, there is a clear possibility that there will be a significant rise in price soon, the same thing happens with a reduced OBV.
How to perform leverage trading using special trading strategies (Trading practice using relevant indicators and strategies, Screenshots required).
- Trend Trading Strategy with Moving Average
The first thing to do before trading with indicators is to be able to identify the trend in the market. Finding trends can be very easy as trends can be identified by either first ruling a line across candlestick pivots of highs or lows heading either upwards or downwards respectively.
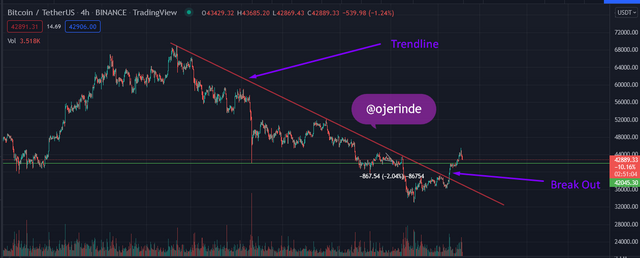
A trend line is formed by drawing a line across two or more candlestick pivots either upwards or downwards in the direction of the market.
After finding the direction, Traders could trade the direction, a breakout which could mean a trend change, While the trend change could still be considered a reversal, it can also be the beginning of a pullback. Do not mistake that this is a 4 hours timeframe and in other to trade with leverage, it is advisable to trade lower timeframe.
Remember that when trading with an indicator, the n-period of the indicator is the total value of the closing price of n, divided by n. Meaning that if i wil be using a 20 moving Average as my indicator, then the result of MA will be the sum of the closing price of 20 candlesticks, divided by 20. I will be using 3 moving Averages in this trade, the 20 moving average, 50, and 70 moving Averages.
To trade this, when the 20 moving average is above the 50 moving average and the 50 moving average is above the 70 moving average, then the market is trading an uptrend. When the 20 moving average is below the 50 Moving Average and the 50 Moving Average is below the 70 Moving Average, then the market is in a downtrend.
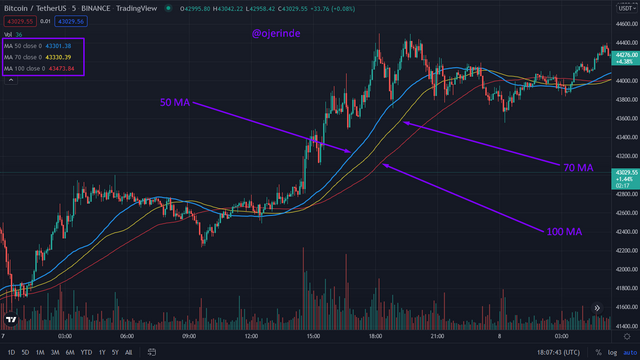
When the 20 Moving average crosses above the 70 and 50 Moving average, then a long position should be taken. When the 20 Moving Average goes below the 70 moving average and the 50 moving average, then a short position should be taken.
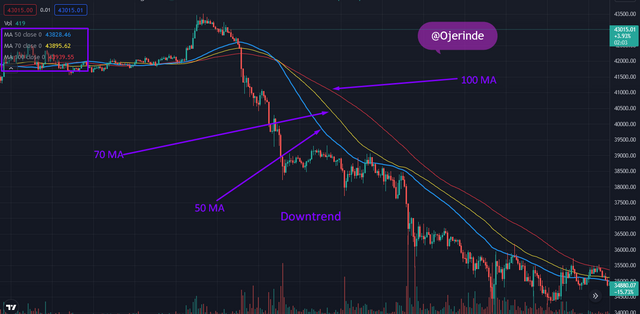
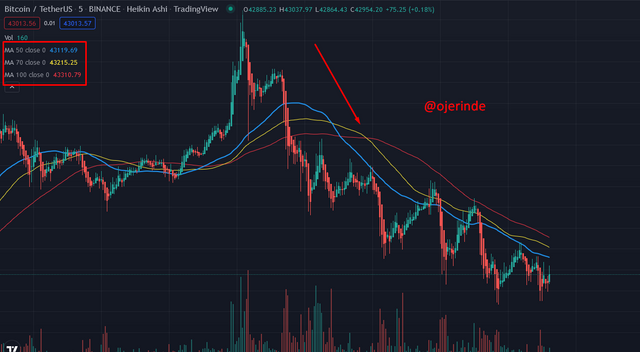
This can be more fun when you use the Heikin Ashi chart showing the red bar when the market is going down and green when it is going up. So when the Heikin Ashi turns red and the 50MA is below the 70 and 100 MAs, then a sell signal is triggered.
Real buy long or sell short position at a suitable entry point in any desired exchange platform
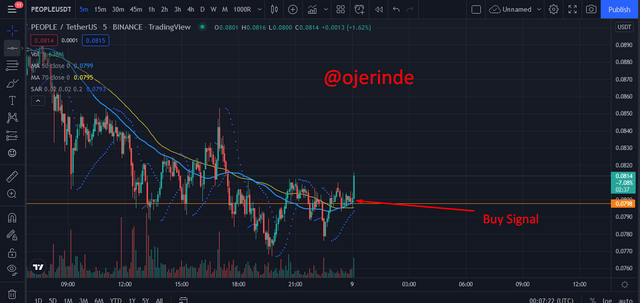
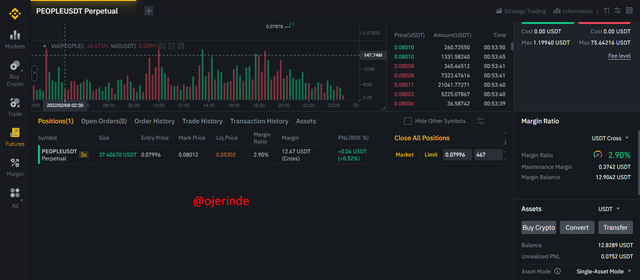
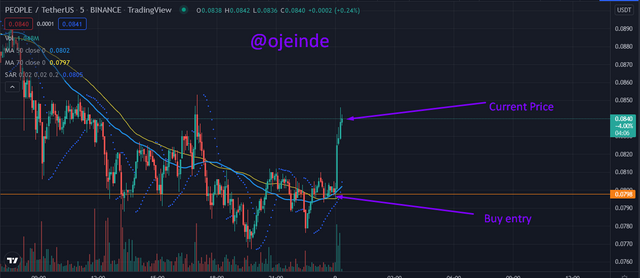
PEOPLE/USDT
Using the strategy, I will be picking a buy trade seeing that the 50 MA moved pass the 70 MA, and 100 MA. I picked the trade at $0.07996 and I will be having a stop loss at $0.0789. I will end the trade when the Parabolic Sar shows that a change/reversal is noticed.
The trade is done at a leverage of 3x making it less risky compared to higher leverages such as 20x or 100x.
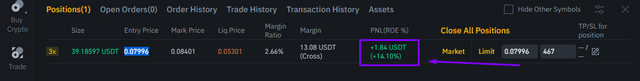
As at the time of still writing, the trade already moved upward confirming my entry signal was a right choice and profit is being. The trade already moved 14%
Conclusion
Trading leverage is very risky for traders who are just finding their feets in the waters of trading. While trading with leverage can be a very good tool, it can be a very dissastrous one as well. It is important to trade with little leverage and do not trade above 2 - 5 percent of uyour entire capital.
Thanks to @reddileep for the lecture, I must confess it was a great one and I had a very nice time answering the questions.