Crypto Academy / Season 3 / Week 8 - Intermediate: Crypto Assets and the Random Index (KDJ) - by Professor @asaj. Homework Task - by @pangoli
.jpg)
My own work
Hey guys...
I am much delighted to be part of this week's lecture with Professor @asaj. Learning about the KDJ indicator for the very first time was both difficult as well as interesting. It became even more interesting when I applied the knowledge garnered in class to solve the homework task...had lots of Aha! moments to throwback on.
Explore with me as I take you through my answers to the homework task below...
Q1: In your own words define the random index and explain how it is calculated
The random index, also known as the KDJ indicator, is an indicator that belongs to the category of Oscillators. It is a price-following indicator that helps traders to identify the changes in the price movements of an asset.
The KDJ indicator is a relatively new indicator that has many things in common with the stochastic oscillator. It is effective in identifying: points of trend reversal, overbought and oversold regions, as well as entry and exit points in the market.
Screenshot| Tradingview.com
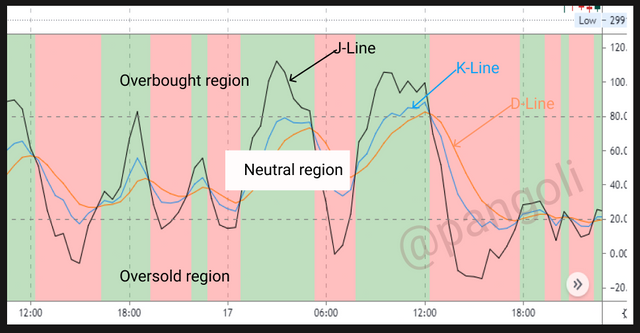
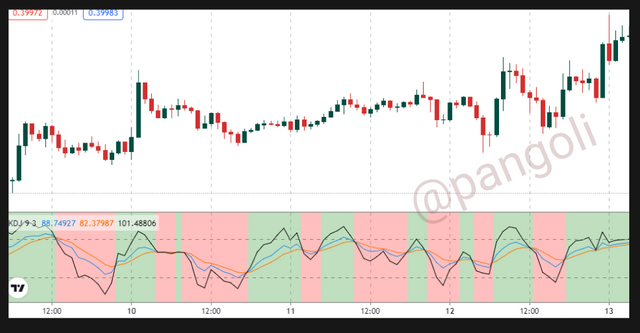
It comprises three lines, namely: K-line, D-Line, and J-line.
While the K-line and the D-Line are similar to the two lines of the stochastic oscillator, the J-line is the additional information present only in the KDJ indicator. The J-line depicts the D-Line's divergence from the K-line.
Also, the KDJ indicator has two horizontal lines set at 80% and 20% respectively. These lines map out overbought and oversold regions from 80% upwards and 20% downwards, respectively. While the region between 20% and 80% is known as the neutral region.
How the KDJ indicator works
The K- line is a quick confirming line and is set to a shorter period to closely approximate price action. A "K" value above 90 is overbought, and a value below 10 is oversold.
The D-line is a slow major line set at a slightly higher period than the K-line. A "D" value above 80 is overbought, and a value below 20 is oversold.
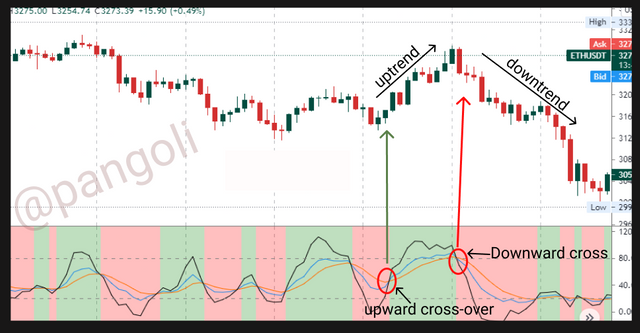
The movement and behavior of the three -KDJ- lines give off useful signals about the price action of an asset. These signals include trend direction, trend reversal, price pull-backs and buy/sell signals.
Screenshot| Tradingview.com
For instance, the market is said to be in an Uptrend when the J-line rallies above the K-line and the D-line. On the contrary, a market is in a downtrend when the J-line rallies below the K-line and the D-line.
An interception of these lines, depending on where it occurs, can signify anything from a minor price rally to a total trend reversal. For instance, if the J-line crosses over the lines K and D from beneath within the neutral zone, it might indicate a minor bullish rally. But, if the crossover happens in the oversold region, it might be a signal that price will revert back to an Uptrend.
Calculating the KDJ Values
To derive the KDJ values, the RSV value is first obtained. The RSV value stands for the Immature random index value of the period "n," with "n" ranging from hours to week, etc. Once the RSV is obtained, the KDJ values can be calculated using the result.
Calculating the RSV value
I will be calculating the RSV for a period 9 days on the ETH/USDT pair, where the 9th day is 19th August, 2021.
Formula:
n-day RSV = (Cn - Ln) ÷ (Hn - Ln) × 100
Where:
Cn = closing price of the nth day = $3184
Ln = lowest price in n days = $2979
Hn = highest price in n days = $3335
Note: prices are rounded up to the nearest whole numbers
Hence, 9-day RSV = (3184 - 2979)÷(3335 - 2979) × 100
RSV = 205 ÷ 356 × 100 = 57.58%
We are setting the previous day's D and K value = 50
Calculating the K value
Formula:
K value of the day = (2 / 3 × K value of the previous day) + (1 / 3 × RSV of the day)
K9 = (2/3 × 50) + (1/3 × 57.58) = 33.33 + 19.19 = 52.52%
Calculating the D value
D value of the day = (2 / 3 × D value of the previous day) + (1 / 3 × K value of the day)
D9 = (2/3 × 50) + (1/3 × 52.52) = 33.33 + 17.51 = 50.83%
Calculating the J value
J value = (3 * K value of the day) - (2 * D value of the day)
J9 = (3 × 52.52) - (2 × 50.83) = 157.56 - 101.66 = 55.9%
Q2: Is the random index reliable? Explain
The KDJ indicator offers meaningful insights on concepts like the direction of market trend, overbought and oversold regions; and signals when a price reversal is happening. However, this does not make it a 100% success rate indicator.
Just like every other indicator for Financial market analysis, the random index is not a stand-alone indicator. The KDJ indicator is an offshoot of the Stochastic oscillator, and therefore, some flaws of the stochastic oscillator are still inherent in it.
As a general rule, the random index does not offer credible signals in a ranging market, as it is more suitable for a trending market.
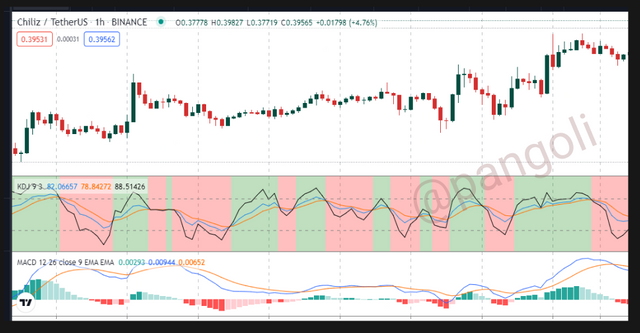
It is always advisable to confirm signals from the KDJ indicator with other indicators to ascertain authenticity before they are deployed in live trading. Using the KDJ indicator along with other indicators helps filter out false trade signals. Let's see an illustration using the CHZ/USDT pair (1hr) below:
Screenshot| Tradingview.com
On the chart, we have the KDJ indicator and the Moving Average Convergent Divergent (MACD). These two will be coupled with price actions shown by candlesticks to confirm trade signals.
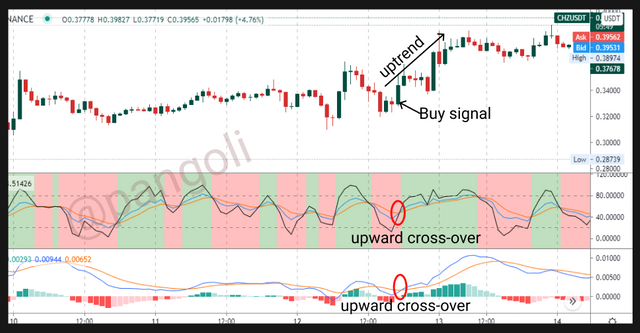
Screenshot| Tradingview.com
We can observe here that the J-line has crossed the K and D lines to the upside. Also, the MACD lines have done a bullish cross-over and we can see that the histograms have flipped to the upside. Since the two indicators have signalled a buy, and the price action on the candlesticks has confirmed the same; It is safe to enter the trade.
Q3: How is the random index added to a chart and what are the recommended parameters? (Screenshot required)
The KDJ indicator can be set up using these simple steps:
Step 1
.png)
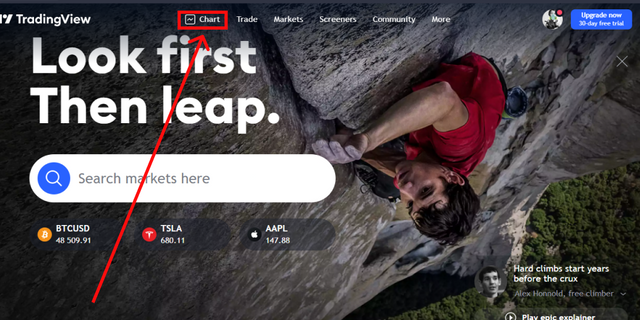
Screenshot| Tradingview.com
Launch Trading view and click on "Chart."
Step 2
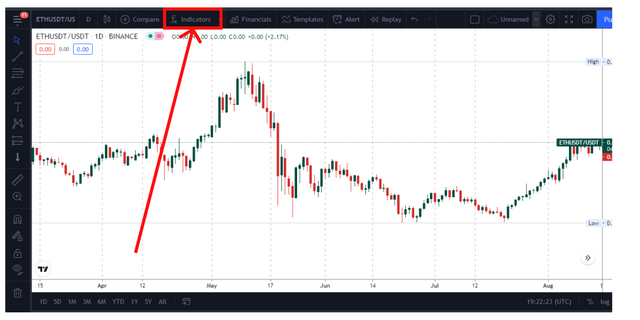
Screenshot| Tradingview.com
At the top of the screen, click the "Indicators icon"
Step 3
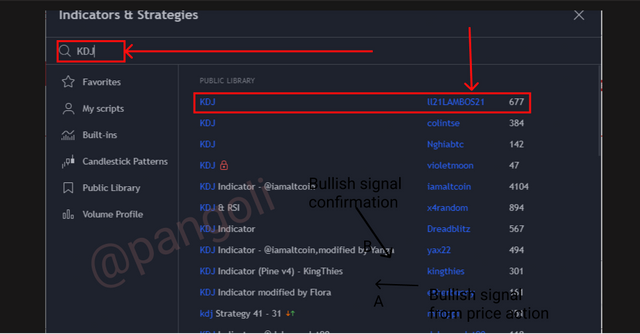
Screenshot| Tradingview.com
On the resulting menu, type KDJ in the "Search box" and choose any Variant of the KDJ indicator from the displayed library.
I chose the one by ll21LAMBOS21 because it has outstanding color-coded backgrounds that make the changes in price movement more obvious.
Screenshot| Tradingview.com
The resulting chart will have the indicator added.
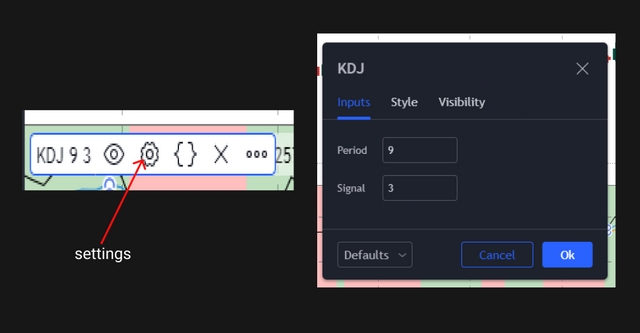
To modify the KDJ indicator
Screenshot| Tradingview.com
- Click on the "Settings" icon on the Indicator's menu
- A menu will appear with options to format the indicator, effect the desired change, and proceed.
You can decide to effect changes to the colors, density as well as inputs of the KDJ lines. The changes effected will appear on the chart window.
Recommended Settings
There is no standard configuration for the KDJ indicator. It is always a discretionary choice for the trader to make. However, a general rule applies, that the periods of the three lines are not too close because it increases the chances of having fake signals.
The default setting of the KDJ indicator is 9:3:3 and this is often the recommended setting. This is so because the periods are far apart and the default setting delivers a fair consistency of authentic signals.
It is also possible to set the KDJ lines at 6:3:3, or 12:3:3. Whatever the combination, it is worthy of note that the signals obtained from a seeing where the periods are not too close to each other are much more reliable.
Q4: Differences between KDJ, ADX, and ATR
The outstanding differences between KDJ, ADX, and ATR indicators are as follows:
KDJ
The KDJ Indicator belongs in the same category as the Stochastic oscillator. It helps reveal the changes in price movement. With values ranging from 0 to 100, the KDJ Indicator also gives information about the state of the market, whether it is overbought or oversold.
ADX - Average Direction Index
The ADX indicator is a non-directional indicator used to determine the strength of price trends. With values ranging from 0 to 100, the ADX indicator gives meaningful insights into the current market trend. An below 20 ADX value implies a weak trend, a value above 25 implies a strong trend, and a value above 50 implies that a major support or resistance zone has been broken.
ATR - Average True Range
The ATR indicator measures market volatility by decomposing the entire range of an asset price for a period. An asset with high volatility will have a higher true range than an asset with low volatility.
Let's summarize the difference in a table:
| KDJ | ADX | ATR |
|---|---|---|
| Directional. That is, it gives information about the direction of the trend | Non-directional | Non-directional |
| Indicates overbought and oversold regions | Indicates the strength of a market trend | Measures the volatility of an asset |
| Gives signal about price reversal | Does not give a signal when there is a price reversal | Only gives information pertaining to price volatility |
| Is classified among market oscillators | Also classified among oscillators | ATX guys into the category of moving averages |
In summary, the KDJ Indicator is seen as a more comprehensive Indicator, because can equally give clues on the information harbored by the ADX and the ATR indicators.
Q5: Use the signals of the random index to buy and sell any two cryptocurrencies. (Screenshot required)
I will use the signals from the random index to buy and sell the LINK/USDT and XRP/USDT pairs.
Buying LINK/USDT
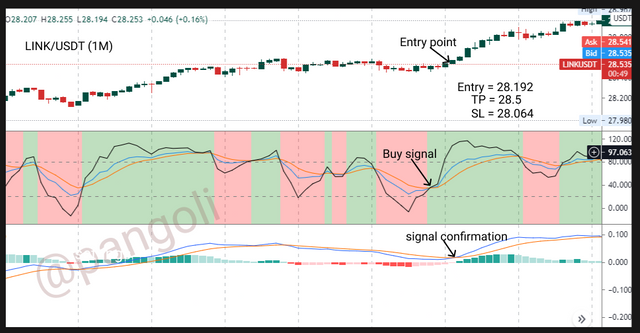
Screenshot| Tradingview.com
On the 1 minute chart at the time of writing, the KDJ lines have a bullish crossover, giving off a bullish signal. I waited for confirmation from the MACD indicator. The MACD indicator as well gave a bullish cross-over and defined my entry point. After that, I proceeded to the exchange to place my trade.
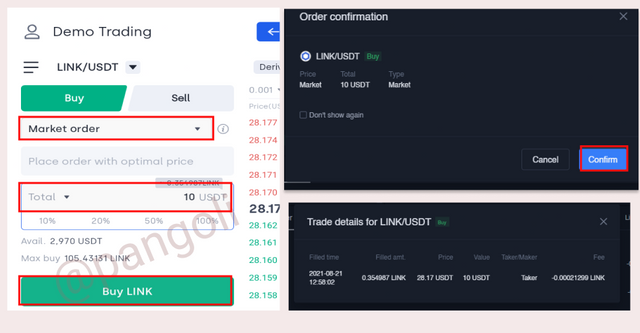
Screenshot| Okex.com
On the exchange interface, I set my "Order type" to "Market order", and proceeded to fill out the required parameters for my trade - Amount, Stop-loss, Take profit. I clicked on "Buy LInk" and confirmed my order in the next pop-up screen.
Trade is executed and the detail of my trade is shown at the bottom-right of the screenshot.
Selling LINK/USDT
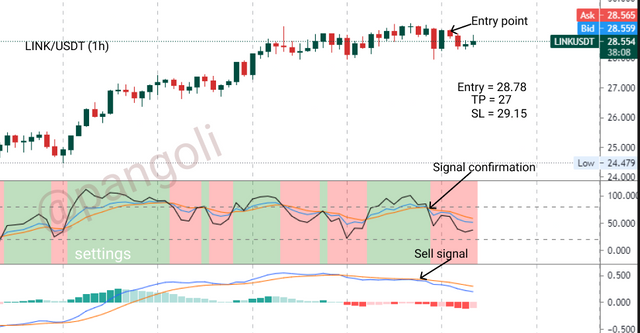 Screenshot| Tradingview.com
On the 1 hour chart at the time of writing, the MACD lines have done a bearish crossover, giving off a bearish signal. I waited for confirmation from the KDJ indicator, which also gave a bearish cross to the downside. With that, I defined my entry point and proceeded to the exchange to place my trade.
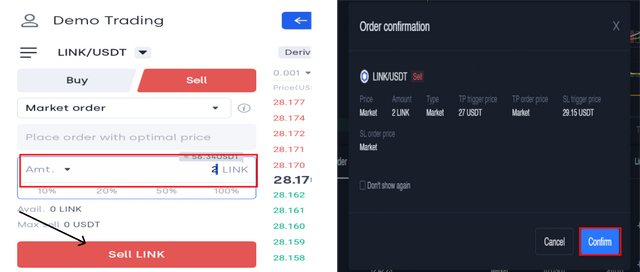
Screenshot| Okex.com
On the exchange interface, I set my "Order type" to "Market order", and proceeded to fill out the required parameters for my trade as displayed on the screenshot - Amount, Stop-loss, Take profit. I clicked on "Sell Link" and confirmed my order in the next pop-up screen.
Buying XRP/USDT
Screenshot| Tradingview.com
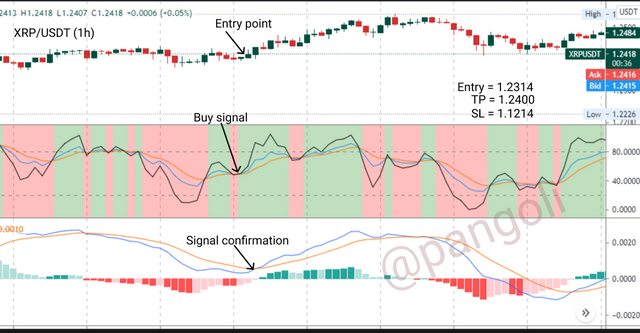
On the 1 minute chart at the time of writing, the KDJ lines have done a bullish crossover, followed immediately by the MACD cross-over to the upside. This is a bullish signal, and with it, I defined my entry point and proceeded to the exchange to activate the trade.
Screenshot| Okex.com
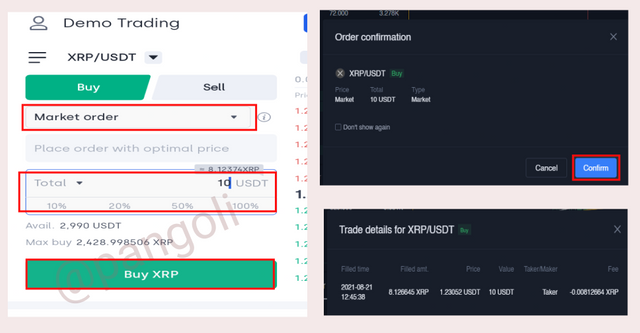
On the exchange interface, I set my "Order type" to "Market order", and proceeded to fill out the required parameters for my trade as displayed on the screenshot - Amount, Stop-loss, Take profit. I clicked on "Buy XRP" and confirmed my order in the next pop-up screen.
Trade is executed and the detail of my trade is shown at the bottom-right of the screenshot.
Selling XRP/USDT
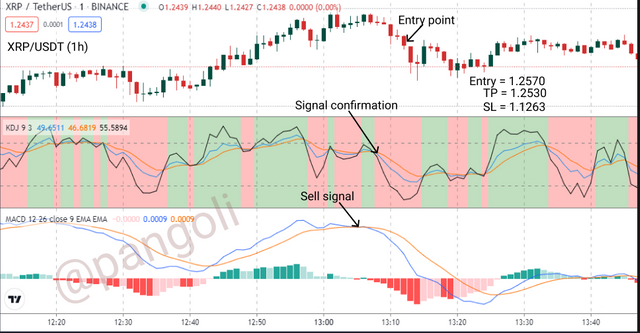 Screenshot| Tradingview.com
On the 1 hour chart at the time of writing, the MACD lines have done a bearish crossover, giving off a bearish signal. I waited for confirmation from the KDJ indicator, which also gave a bearish cross to the downside. With that, I defined my entry point at 1.2570 and proceeded to the exchange to place my trade.
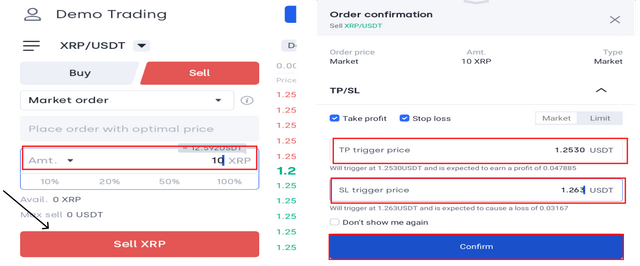 Screenshot| Okex.com
On the exchange interface, I set my "Order type" to "Market order", and proceeded to fill out the required parameters for my trade as displayed on the screenshot - Amount, Stop-loss, Take profit. I clicked on "Sell XRP" and confirmed my order in the next pop-up screen.
Conclusion
Although to a very large extent, the KDJ indicator is not popularly used by traders of the financial market, it is a very useful indicator. With the KDJ Indicator, traders can easily identify the direction of market trends, and spot when the market is overbought or oversold. Also, traders can get favourable entry and exit points by using price signals from the KDJ indicator.
When carefully applied and used alongside other useful indicators, the KDJ indicator can help a trader stay profitable in the market.
Thanks for reading...
Cc:
@asaj
@steemitblog
Superb performance @pangoli!
Thanks for performing the above task in the eighth week of Steemit Crypto Academy Season 3. The time and effort put into this work is appreciated. Hence, you have scored 9 out of 10. Here are the details:
Remarks
Overall, you have displayed a good understanding of the topic. You have performed the assigned task excellently. However, your work could benefit from more research.
That said, this is good work. Thanks again for your contributing your time and effort to the academy.