STEEMIT CRYPTO ACADEMY SEASON 3 WEEK 4. TOPIC: CANDLESTICK PATTERNS - BY PROFESSOR @reminiscense. Homework task - by @pangoli
.jpg)
Image: My own work
Hey guys....
I'm really excited to partake in this week's homework task. It's been another deep dive into the waters of technical analysis with Professor @reminiscence, and I can say that I have gathered enough knowledge to make sense of the charts that once felt like rocket science to me.
I have my answers to the homework task below, and I'm sure you'll have a pleasant read as you proceed.
Q1: Explanation of the Psychology behind Candlestick patterns
Engulfing candlestick patterns
Engulfing candlestick patterns are oftentimes indicative of a change in the market trend. It is easily spotted when a second candle closes with a body size significantly bigger than the preceding candlestick in a trending market. Depending on the direction of the existing market trend engulfing candlestick patterns are of two types:
- Bullish engulfing candlestick pattern
- Bearish engulfing candlestick pattern
The Bullish engulfing candlestick pattern
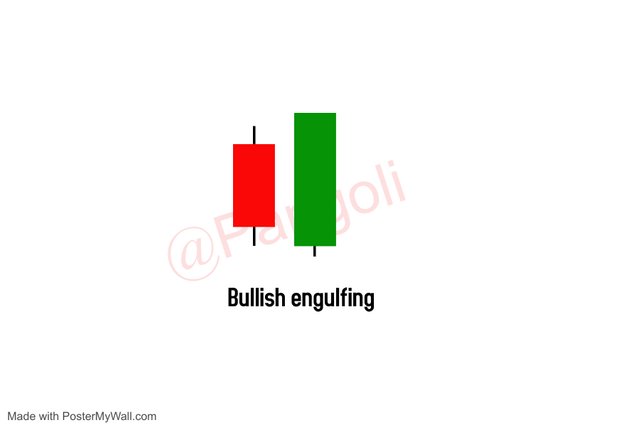
Image: My own work
A bullish engulfing candlestick pattern consists of two candlesticks- a bearish candle, followed by a bullish candle with a body size significantly bigger than the preceding bearish candle.
The simple psychology behind this pattern is that the bears (sellers, represented by red candlesticks) were in control of the market, but have been overrun by the bulls (buyers, represent by green candlesticks). Since the control has shifted to the buyers, it is expected that the market trend will change into an uptrend following the buyer's takeover.
This pattern of candlesticks is usually seen in downward trending markets, and often appears at the end of a downtrend, hinting at an impending trend reversal. A downtrend indicates that the bears are in control of the market, this is captured by the dominant red candles.
The bearish engulfing candlestick pattern
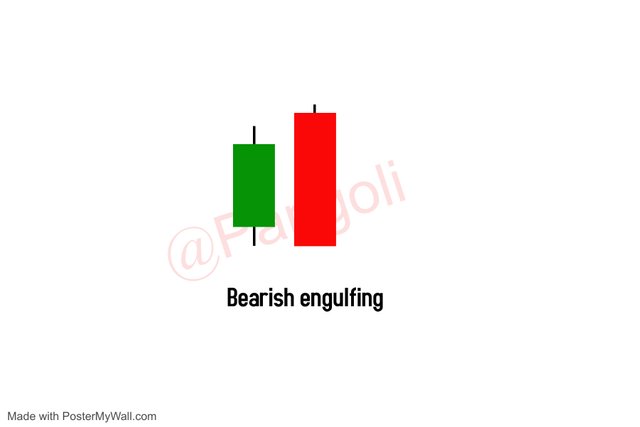
Image: My own work
A bearish engulfing candlestick pattern, just like its bullish counterpart, consists of two candlesticks - a bullish candle, followed by a bearish candle with body size significantly bigger than the preceding bullish candle.
The psychology behind this pattern is that the bears (sellers, represented by red candlestick) are taking over control from the bulls (buyers, represented by the green candle) who were previously ruling the market with a sustained buying pressure. Since the control has shifted to the sellers, the expectation is that the market trend, which was initially upward, will change into a downtrend following the sellers' takeover.
The Doji
The Doji candlestick is usually seen as an indecision candle because it lacks a part of the ideal candlestick called body. The Doji appears mostly as an intersection of lines, indicating an ongoing tussle between the buyers and the sellers on who should take over the market.
The lack of body in the Doji candlestick indicates that the market for the period considered traded within a very narrow price window, as there is no significant difference between its opening and closing price.
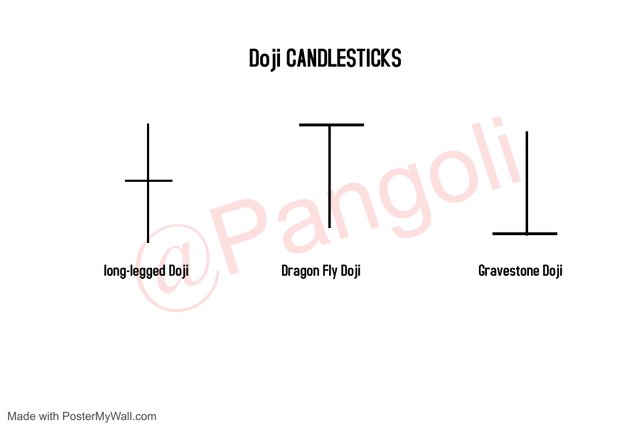
Image: My own work
Doji candlesticks come in different variation, with each bearing a significant information about the market's indecision and who among the bulls or bears is likely to take over.
To get a better understanding of what the Doji is saying, attention is paid to the location of the Doji - whether they appear at major zones, at the end of up or downtrends, etc - as they can be obvious signals of trend reversal or continuation. Also, the next few candles that form after the Doji serve to confirm which direction the market goes after the Doji.
The Hammer candlestick patterns
Hammers fall into the category called rejection candles. Rejection candles often mark inflection points in the market. A typical Hammer consist of a small body and a long wick, indicating a level of price rejection.
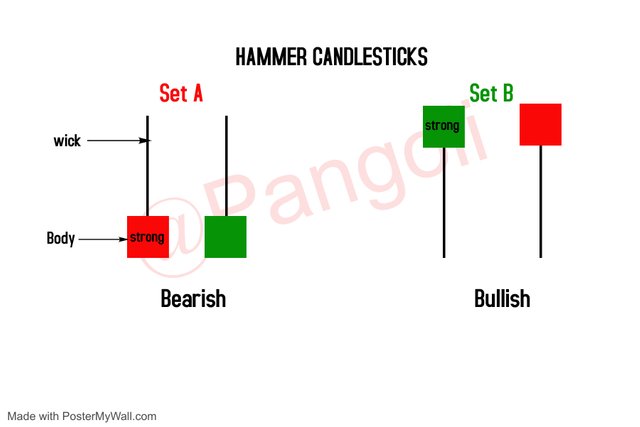
Image: My own work
The hammer candlesticks are of different types - labeled in the diagram above, with each bearing a particular sentiment about the market.
Set A: The inverted hammer
A hammer with a short body and a long wick above its closing price indicates that the buyers had pushed the price very high but lost steam along the way, then the sellers came in and pushed down the price to close just a little above the period's lowest price.
In a normal market scenario, the long wicks above the candlesticks are interpreted as sell-off points where traders take their profits in anticipation of a price drop. Irrespective of the color of the candlestick, these kinds of candles leave hints of impending sell pressure.
These candlesticks might entail a trend reversal or continuation, depending on where they appear. For instance, if any of these candles is found at the top of an uptrend, near a key market resistance zone. It might mean that the direction of the trend will soon change. Whereas, if it appears at the bottom of a downtrend, near a key market support zone, it might mean that price would still continue in the previous direction
Set B
A hammer with a short body and a long wick below it's closing price indicates that sellers had pushed the price very low, but the buyers stepped in with a strong buying pressure and pushed up the price to close just a little above or below the opening price.
The market sentiment around these kinds of candlesticks are that traders bought the dip, that is, buyers took advantage of the huge drop in price to purchase more assets at cheaper rates. Usually, this market behavior precedes a reversal of the market direction into an uptrend.
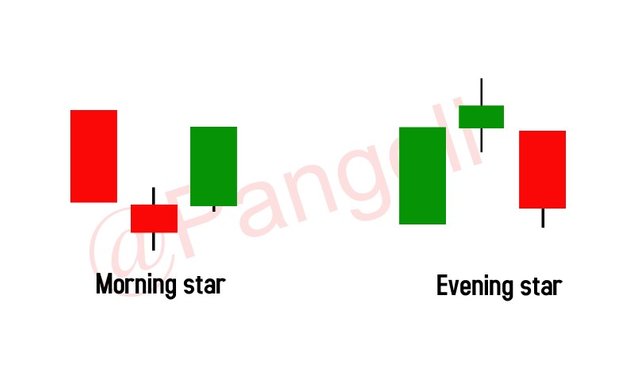
The morning and evening star candlestick patterns
.jpg)
Image: My own work
The morning star candlestick pattern:
This candlestick pattern is usually printed at the end of a downtrend. It comprises of three candlesticks:
- A bearish candlestick, indicating that the sellers are in control of the market.
- An indecision candle - the Doji, indicating exhaustion in selling pressure. Here, it becomes obvious that sellers can't move the price further down.
- A bullish candlestick, indicating a bullish takeover of the market.
The morning star candlestick pattern gives information that there is a coming bullish reversal of the existing market trend.
The evening star candlestick pattern:
This candlestick pattern is usually printed at the end of an uptrend. Like the morning star, It comprises of three candlesticks:
- A bullish candlestick, indicating that the buyers are in control of the market.
- An indecision candle - the Doji, indicating exhaustion in buying pressure. Here, it becomes obvious that buyers can't push the price up anymore.
- A bearish candlestick, indicating that the market control is shifting to the bears.
The evening star candlestick pattern gives information that there is a coming bearish reversal of the existing market trend.
Q2: Identify candlestick patterns and state the price reaction
Beyond the theoretical explanations, the candlestick patterns discussed in Q1 show up evidently on Financial market charts. In this section, we will be identifying these candlestick patterns and their market implications, using real market charts of trading assets.
1. Bullish Engulfing candlestick pattern
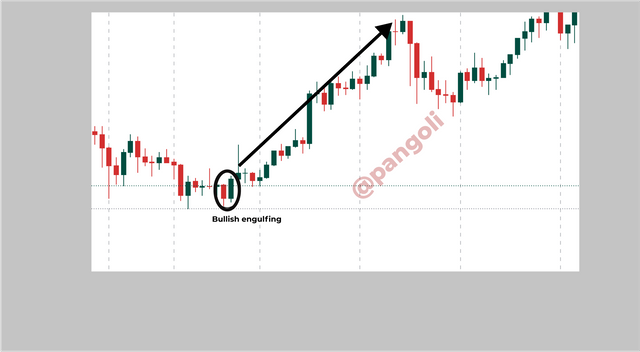
Image: My own work
In the image above, the marrket was in a downtrend. At the bottom of the downtrend, we can observe the formation of a bullish engulfing price pattern, and an upward price rally follows aftterwards.
2. Bearish Engulfing candlestick pattern
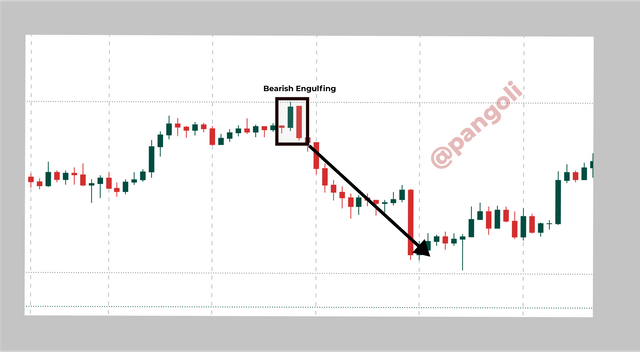
Image: My own work
As shown in the picture above, the upward trending market came to a halt at a point where the bearish engulfing candle pattern showed up. To confirm the price reversal that this candlestick pattern represents, it can be observed that the price made a consistent decline following the formation of the bearish engulfing candlestick pattern.
3. The Doji ( Gravestone, Long-legged and Dradon fly Doji)
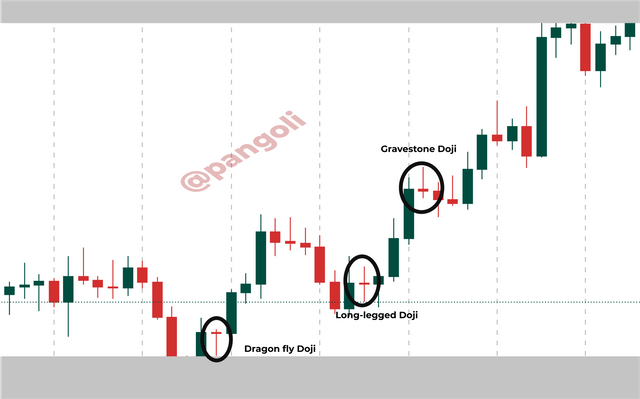
Image: My own work
The image above captures all three kinds of the doji candlesticks in a single market move. The doji is a versatile candlestick type and does not have a complete information, standing alone. The only constant thing about the Doji is that it represents a point of uncertainty between buyers and sellers. This uncertainty might result in a price reversal or continuation, depending on which side of the market makes the next impulsive move after the Doji.
In my illustration, the Doji is often followed by an impulsive bullish candlestick, after some very weak bearish candlesticks have been printed. Thus, we can observe that the price tends to move sideways after the Doji, before making and impulsive move upward. The Doji in the image above were all signs of a trend continuation.
4. Hammer candlestick pattern
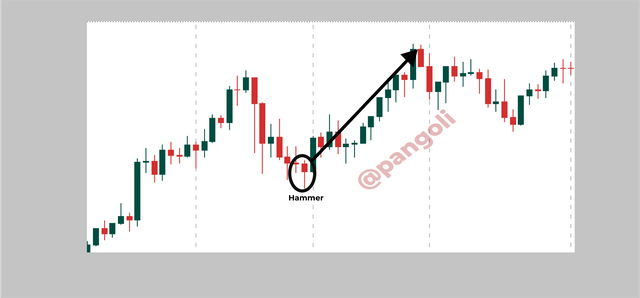
Image: My own work
In the image, the hammer marked the end of a temporary price pull-back, signifying a continuation of the uptrend that was prevalent before the temporary pullback occured. Based on its location, the hammer here was a trend continuation signal.
5. Inverted hammer candlestick pattern
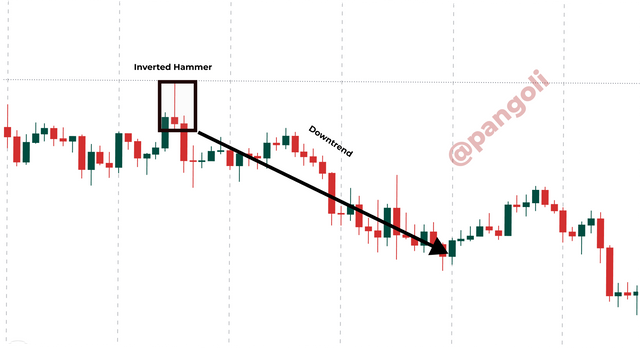
Image: My own work
The inverted hammer candlestick pattern in seen at the top an uptrend, based on its location at the zennith of an uptrend, it represents an impending price reversal. We can observe that price reversed into a downtrend after the inverted hammer candlestick pattern.
6. The morning star candlestick pattern
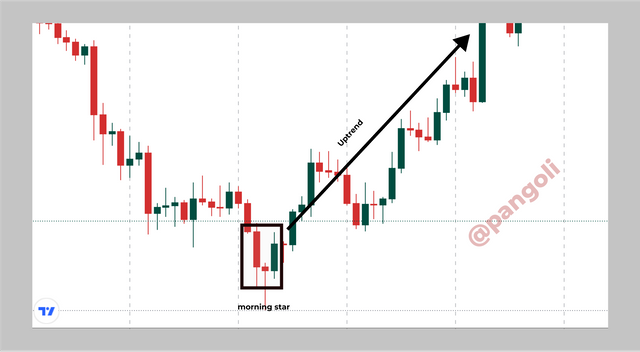
Image: My own work
Here we can see that the morning star candlestick formed after what could be perceived as a downward trending market. Following the morning star candlestick pattern formation, price made a switch into an uptrend and made a sustained upward rally. Just as is often the case, this was a trend reversal pattern.
7. The evening star candlestick pattern
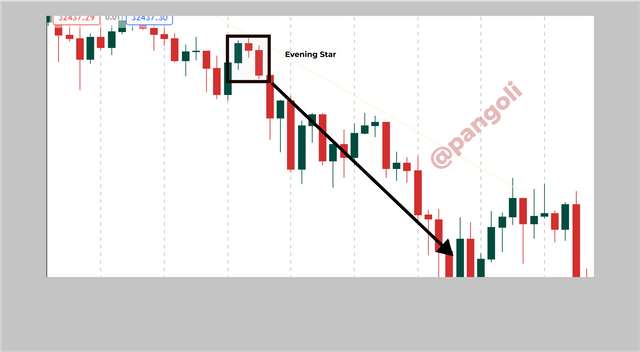
Image: My own work
The evening star often marks a turning point in the market in favour of the bears. In the image above, the evening star candlestick pattern led to a sustained downward trending market.
Q3: Analysis of a Demo trade
For my demo trade analysis, I will be using the tap trader application to analyze the BTC/USDT pair.
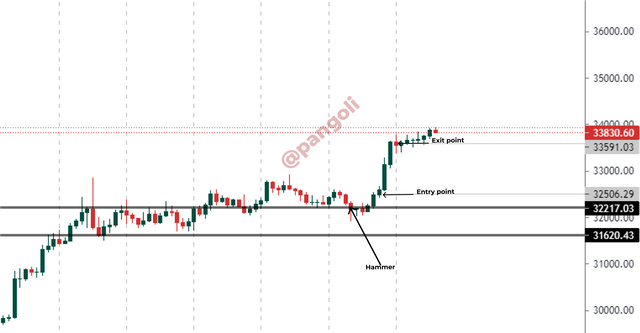
Image: My own work
From the chart, I observed a hammer formed on the support line, which indicates a potential continuation of the existing uptrend. I confirmed the signal with the next few candles after hammer, and having verified the market signal as bullish, I proceeded to gain an entry point at the close of the second obvious bullish candlestick.
I entered the trade at 32506 and targeted 33591 to take profits. For my trade management, I used a stop-loss which was set around the support line at 32217
Conclusion
Understanding candlestick patterns and the psychology of candlesticks formation, are key skills for traders to have in their quiver. This knowledge does not only add to the list of things a trader should know, it can be the only tool to have a very clear perception of the market and its behaviour.
Using the insights from candlestick formation and patterns, alongside other key market indicators can help a trader minimize the risk of jumping on false signals and making losses.
Thank you for reading.
Hello @pangoli , I’m glad you participated in the 4th Week of the Beginner’s class at the Steemit Crypto Academy. Your grades in this task are as follows:
Recommendation / Feedback:
Thank you for submitting such a quality content.