Steemit Crypto Academy Season 3 Week 5. Topic: Market Patterns and Blockchain Projects - by Professor @imagen. Homework task - by @pangoli
.jpg)
My own work
Hello guys...
It brings me much pleasure to participate in this week's lecture with Professor @imagen. Learning about candlestick patterns has been a huge exposure and I've gathered even more technical knowledge of the market from this week's lecture.
I have my attempt at the homework tasks presented below. I hope you have a good time reading through.
Q1: Chilliz CHZ purchase Process and Fundamental Information
Step by Step process to purchase Chilliz on Binance exchange.
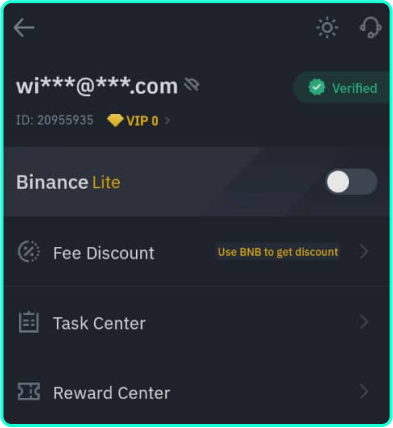
Before I proceed with the step-by-step process, here is a screenshot of my verified Binance account:
My own work
Note: It is assumed that the user has already set up and logged into his Binance account.
Step 1:
.png)
My own work
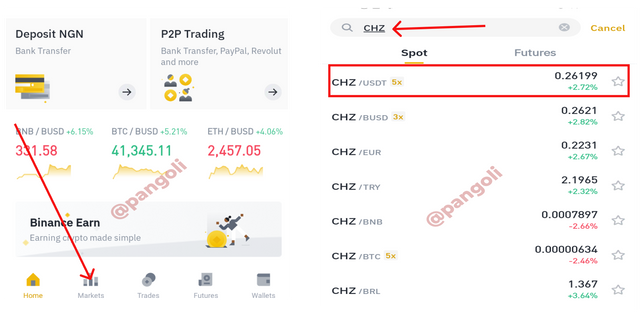
On the Binance home page, click on the market icon at the bottom of the screen as shown on Screenshot 1.
You will be redirected to a page with different asset pairs
Search for the preferred asset pair and click on it. As shown in the screenshot, I searched and clicked on the CHZ/USDT asset pair. This will take you to the market interface where you have the asset's chart.
Step 2:
.png)
My own work
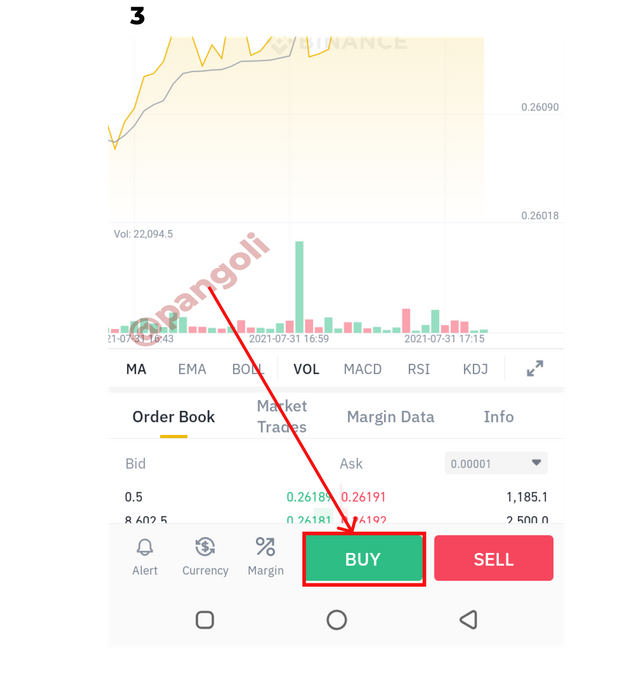
At the bottom of the market interface, Click on "Buy." You will be taken to the order invoice page where you'll be required to fill out the amount of asset you want to buy.
Step 3
.png)
My own work
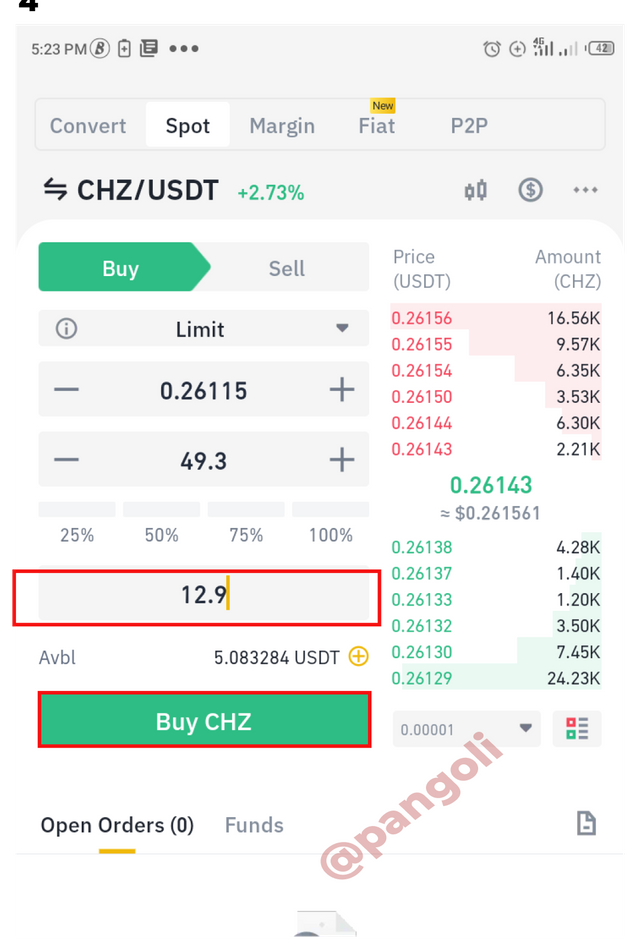
Fill out your order and click on "Buy CHZ."
As presented in the screenshot, I bought $13 worth of CHZ. My order got executed.
To confirm if the transaction was successful
.png)
My own work
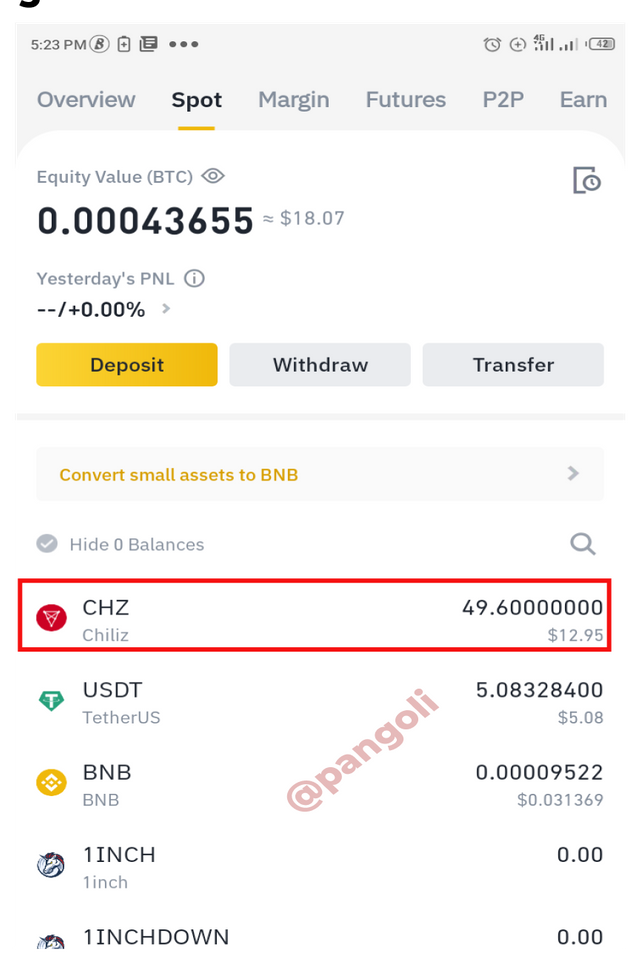
Click on "wallets" at the bottom of your screen, your CHZ balance should reflect the new purchase you've just made just like mine on the screenshot.
Why I chose this cryptocurrency?
The world of sports is one without boundaries, as there are millions of persons all over the world, who are die-hard fans of one sport or the other. Chiliz (CHZ) provides a medium where sports fans can deepen their support by directly participating in the team's decision-making through voting, and get rewarded based on fans' engagement.
Fans' engagement has always been a constant factor in sports and entertainment. Now, when this engagement becomes a basis for reward and recognition, as the Chilliz platform is suggesting, there will be a huge value addition to the Chiliz token as sports fans all over the world wake to embrace the idea.
Market Capitalization and ranking
According to Coin Market Cap the key matrices of the Chilliz (CHZ) token are as follows:
| Fundamental Information | |
|---|---|
| Market Capitalization | $1,540,143,440.74 |
| Crypto asset ranking | #61 |
What is the objective of the project behind this coin?
Chiliz (CHZ) is built with the objective of being a blockchain-based Fintech service provider for sports and entertainment.
Who founded this coin?
According to Cointelegraph.com, the Chiliz coin was founded by Alexandre Dreyfus, an entrepreneur with years of experience in the gaming and sports industries.
Show the roadmap.
There is no roadmap on the Chiliz website, but according to events information curated by Coindar.org, Chiliz roadmap is presented as follows:
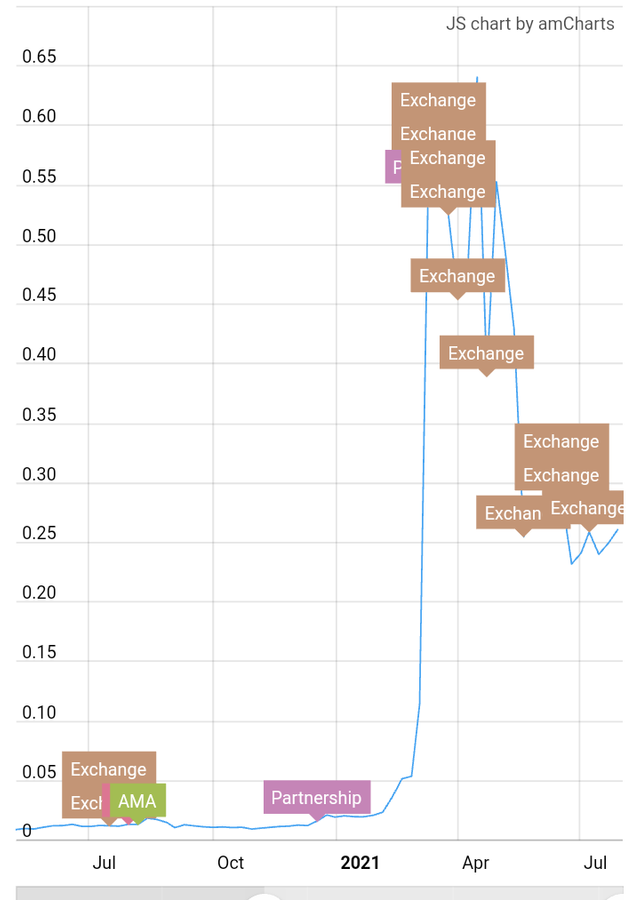
image source
What is the specific purpose of the cryptocurrency?
To provide sports & entertainment entities with blockchain-based tools which will help them engage & monetize their audiences.
Q2: Explain in your own words what the "Evening Star" pattern consists of. What is its hit rate?
The evening star candlestick pattern:
.jpg)
My own work
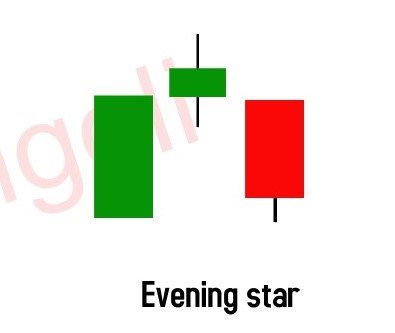
This candlestick pattern is usually printed at the end of an uptrend. It is one of the candlestick patterns that signify an impending price reversal. The evening star candlestick pattern comprises of three candlesticks:
- A bullish candlestick, indicating that the buyers are in control of the market.
- An indecision candle - the Doji, indicating exhaustion in buying pressure. Here, it becomes obvious that buyers can't push the price up anymore.
- A bearish candlestick, indicating that the market control is shifting to the bears.
The evening star candlestick pattern gives information that there is a coming bearish reversal of the existing market trend.
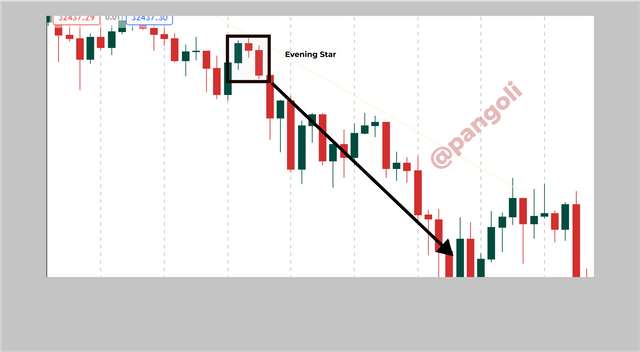
My own work
As shown on the chart above, the trend of the market switched into a downtrend after the formation of the evening star candlestick pattern.
Q3: Explain what the pattern "Abandoned Baby" consists of. What is the percentage correct?
The abandoned baby candlestick pattern is one of the many price reversal patterns. That is, once it is spotted on the charts, depending on the current trend, there is a tendency that price will soon do a rally in the opposite direction.
This candlestick pattern is made of three candlesticks:
- An impulsive bearish/bullish candlestick
- A Doji that gaps away from the close of the previous candle
- A sizable-bodied bullish/bearish that engulfs the second candle in the opposite direction.
The abandoned baby candlestick pattern can be printed as a bullish or bearish reversal signal, depending on the direction of the trend prior to its appearance.
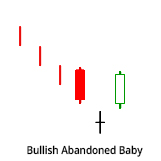
The Bullish abandoned baby candlestick pattern
Image source
This pattern usually shows up at the end of a downtrend. It follows after a strong selling pressure which has seen price maintain consistent lower levels over a period of time.
The Bullish abandoned baby candlestick pattern comes as a union of three(3) candlesticks, which are as follows:
- An impulsive bearish candlestick indicating that sellers are still in control of the market
- A Doji that gaps below the close of the first candle. This is an indication that sellers are losing their control over the market, as they are unable to push the price any further.
- A bullish candle that opens above the previous (Doji) candle. This buttresses the fact that the buyers have stepped in and are gradually taking over control of the market.
Once this pattern is spotted with its associated candlesticks at the bottom of a downtrend, it is safe to say that there is a coming reversal in price. To confirm this signal, it is always advisable to pair up price action with other indicators, preferably an oscillator.
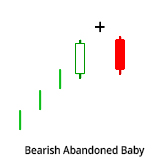
The Bearish abandoned baby candlestick pattern
Image source
Contrary to its bullish counterpart, this pattern is usually seen at the top of an uptrend. It follows after a strong buying pressure which has seen price maintain consistent higher levels over a period of time.
Just like the Bullish case, the bearish abandoned baby candlestick pattern comes as a pack of three(3) candlesticks, which are as follows:
- An impulsive bullish candlestick indicating that buyers are in control of the market.
- A Doji that gaps above the close of the first candle. This is an indication that buyers are losing their control over the market, as they are unable to push the price higher.
- A bearish candle that opens below the previous (Doji) candle, indicating that the sellers have stepped in and are gradually taking over control of the market.
Once the bearish abandoned baby pattern is spotted with its associated candlesticks at the top of an uptrend, it could be said that there is a coming reversal in price. As previously stated, it is expedient to confirm this signal, it is always advisable to pair up price action with other indicators, preferably oscillators, to have a clearer result.
Q4: Analysis for 3 and 7 recent calendar days on Bitcoin
Patterns spotted on the 3 Calendar days Analysis
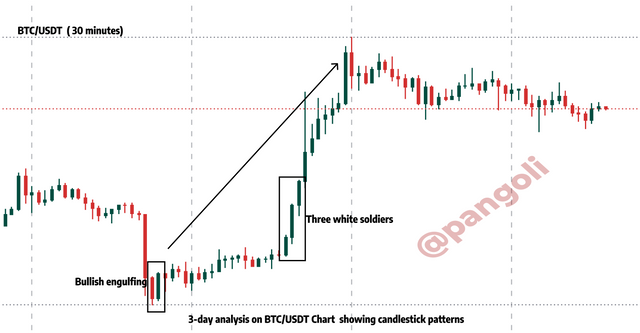
My own work
On the recent 3-day analysis of the Bitcoin chart, the obvious patterns noticed were the Bullish engulfing and the 3 white soldiers candlestick patterns. These patterns are bullish indicators, and show up as a signal that the price will do an upward rally.
Patterns spotted on the 7 Calendar days Analysis
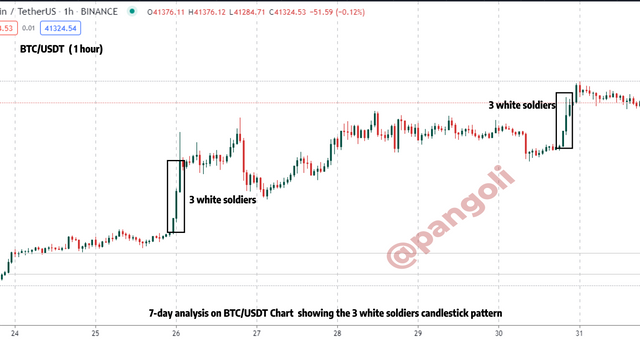 My own work
 A 7-day recent analysis of the BTC/USDT pair shows the 3 white soldiers pattern printed at different intervals on the chart. This further consolidates what was seen on the 3-day analysis that Bitcoin is driving on a bullish market sentiment.
Conclusion
Candlestick patterns are crucial technical indicators that give very good information about price movement. When paired up with other appropriate indicators, candlestick patterns can help traders reduce their risk of taking losing trades; thus, minimizing losses and maximizing profits.
Gracias por participar en la Tercera Temporada de la Steemit Crypto Academy.
Felicitaciones, realizastes un gran trabajo.
Continua esforzandote y espero seguir corrigiendo tus asignaciones.