Technical Indicators II - Crypto Academy / S4W4- Homework Post for @reminiscence01"
Introduction
There are several technical tools that traders can utilize to gain proper insights on the activities of buyers and sellers in the financial markets. Indicators are some of those tools built with historical price data to aid future price predictions.
These price indicators are sub-divided into two groups, leading and lagging Indicators, depending on whether they trigger their signals before or after a certain price action has taken place. Let's learn more about these categories of Indicators as we solve the homework tasks below.
Q1a. Explain Leading and Lagging indicators in detail with examples
Leading Indicators
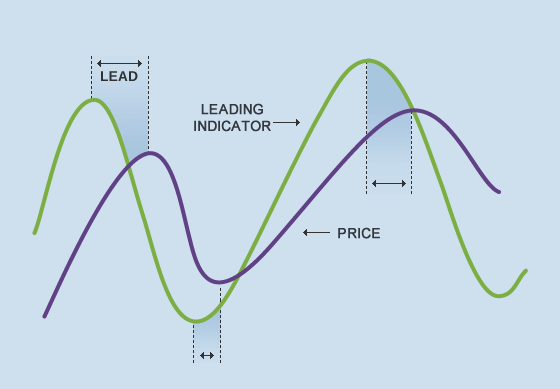
Image| babypips.com
As the name implies, leading Indicators often precede price action. That is, they give off a signal before the market trend goes in a certain direction. Leading Indicators are a good way to jump on a market trend before the party starts.
If they were human and could speak, I believe leading Indicators would speak along the lines, "hey, we are about to do a quick run, get your shoes on and be ready." You know, telling you what lies ahead so you don't freak out when it happens on you.
Indicators that fall in this category are mostly oscillators like the Relative Strength Index (RSI), Stochastic oscillator, Average Directional Index, KDJ, etc.
Some traders might already feel like they've found their trading gold mine in leading Indicators. Not so fast! These indicators, although fast in telling what's about to happen in the market, are often flooded with false signals and this makes them unreliable most of the time.
Oftentimes, signals from leading indicators do not result in the predicted price action. This is called a fake out in common trading lingo, and a trader who followed a leading indicator's signal to trade in this case might have a complete shipwreck in form of loses. This makes the point that leading indicators sometimes give misleading signals.
To avoid the scenario explained in the last paragraph, it is expedient to know and understand the market conditions in which the leading indicators can deliver more accurate results. According to babypips, leading indicators deliver more accurate signals in range-bound markets. That is, when the market is trading sideways.
Lagging Indicators
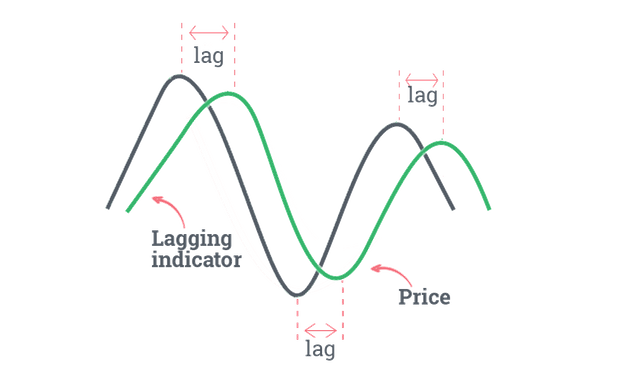
Image| fxssi.com
On the other end of the rope, there are indicators that only alert a trader about market moves after the said move has happened already. Here, the market does a significant number of candlesticks in a certain direction before the Indicator gives a signal. Just as the name implies, it lags a lot.
Indicators in this category include: Moving Average indicators, Bollinger Bands, Parabolic SAR, etc.
Again, unlike the leading indicators that say " hey buddy, the bulls are about taking over market, you might want to buy now." The lagging indicators reason along these lines, "hey buddy, the bulls have taken over the market. If you don't think it's too late, you can still buy now."
Lagging Indicators are often considered a safer option to the leading counterpart. This is because, in most cases, their signal come after the corresponding market move has already occurred. This might seem like a trader is coming in when the party is over, but it does prevent the trader from jumping into the market as a result of a false signal.
Just like the leading counterpart, lagging indicators have their ideal market situation. That is, there are certain market conditions in which they can deliver near accurate results. To get the most out of lagging indicators, it is often advised that they are used in a trending market.
Q1b. With relevant screenshots from your chart, give a technical explanation of the market reaction on any of the examples given in question 1a. Do this for both leading and lagging indicators.
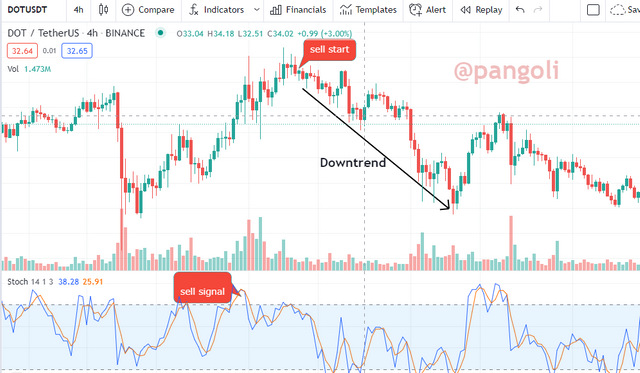
Image|Tradngview.com
From the screenshot above, a leading indicator - the stochastic oscillator- was added to the DOT/USDT chart. The indicator gave off a "sell signal" at the point indicated on the chart, and we can see the price action reacting in confirmation of the indicator's signal a few moments later. The resulting trend from these signals was the long downtrend line indicated with the arrow.
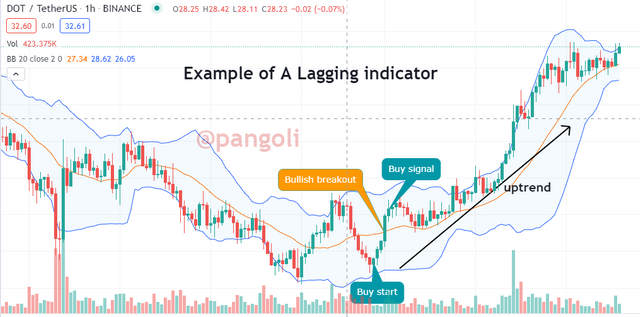
Image| Tradingview.com
Here, a typical lagging indicator - Bollinger bands - was added to the price chart of the DOT/USDT pair. From the chart, we can observe that price action has already printed a few number of candlesticks in the direction of the new trend before the signal came from the Bollinger bands. The resulting trend after the bullish breakout of the middle Bollinger band led all the way up as indicated by the black arrow.
Q2a. What are the factors to consider when using an indicator?
Indicators are not some cookie-cutter solution that can be applied to the market at anytime to deliver results. There are some key factors to consider before making a choice of an indicator. Let's explore some of these factors below.
1. Trader's Understanding of the market
This involves an overall assessment to determine if the market is trending or range-bound. As earlier discussed, the different categories of indicators have their ideal market conditions. Once the market condition is understood, a proper choice of which Indicator applies to the realized condition can be made.
2. Trader's Understanding of Indicators
The knowledge of how a market Indicator operates is crucial to its profitable usage. With a proper knowledge of how these indicators work, a trader will be better positioned to apply them in a way that will deliver accurate results.
For instance, a proper knowledge of Indicators will help a trader apply trend-following indicators in a trending market, and leading indicators in a range-bound market.
3. Confirmation options
It is a known fact that no Indicator can function in isolation. At every point in time, signals from one Indicator has to be subjected to some form of confirmation with other indicators that do not have the same properties.
Knowing the right set of complementing indicators to pick for this function is another crucial factor in choosing indicators. The overall aim is that losses are minimized when trades are picked as a result of the signals gathered from these Indicators.
4. Having a style and strategy
Although any Indicator can be adapted to a trader's style and strategy, having the understanding of the kind of trader you are will help adjust these Indicators to suit your preferences. For instance, the necessary parameters on indicators can be adequately adjusted to fit each trader's trading style, be it a scalp traders, swing trader, day trader, etc.
Also, having an established strategy would help a trader make the most of market indicators. This is because the trader will not jump at every buy or sell signal suggested by the Indicator, but will better be able to filter out market noise based on the existing strategy.
Q2b. Explain confluence in cryptocurrency trading. Pick a cryptocurrency pair of your choice and analyze the crypto pair using a confluence of any technical indicator and other technical analysis tools.
Confluence is simply a situation where multiple technical indicators say the same thing about the market. It refers to that point where two or more technical indicators give off the same buy/sell signal with respect to the directional movement of an asset's price.
Confluence points are an integral part of market analysis and trading process because they increasesl the probability of making a winning trade if the suggested signals are followed through. A typical example of a confluence point in the crypto market is illustrated below.
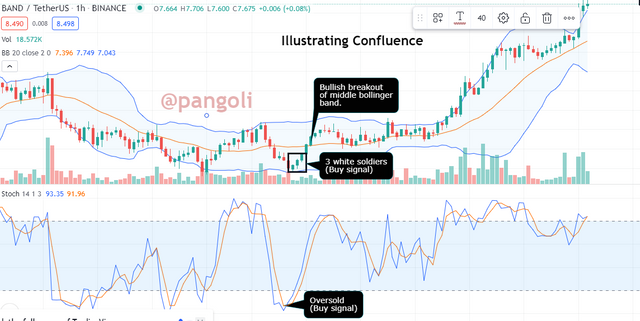
Image| Tradingview.com
Using Bollinger Bands and the stochastic oscillator Band/USDT 1hr chart. We can observe that the market was trending downwards, and reached a bottom where the stochastic oscillator made a golden cross.
Following the olden cross on the stochastic oscillator window, we can see confluence in action when the candlesticks printed three consecutive bullish candlesticks - the 3 white soldiers pattern, further confirming the bullish signal from the stochastic oscillator.
Also, the bullish signal got another validation when the candlesticks broke the middle Bollinger Band to the up side.
These are three separate market indicators suggesting a bullish reversal in the market. Hence, it can be concluded that this is an authentic signal, and this is obvious in the resulting price action. The resulting trend rallied all the way up in a sustained bullish momentum.
Q3a. Explain how you can filter false signals from an indicator
As far as market indicators are concerned, there is always a high chance of coming across false signals. That is, a situation where the Indicator says one thing and the market does the exact opposite.
In this case, there is need to reiterate the fact that indicators alone do not have sufficient information to do a proper prediction of the market. Hence, there is need to always match Indicator signals to price action in order to understand exactly what is happening in the market.
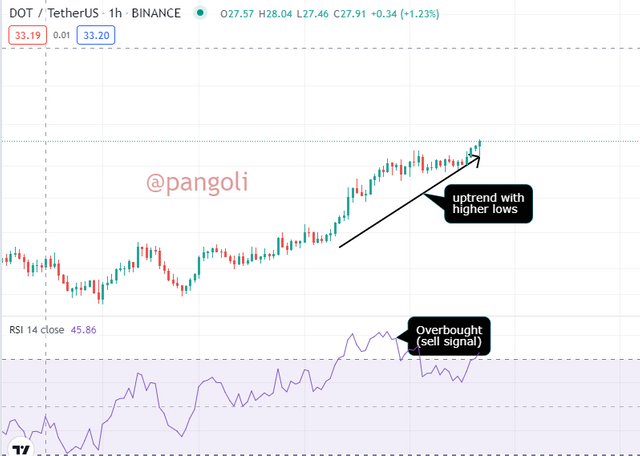
Image| Tradingview.com
For instance, on the chart below, the stochastic Indicator has already signaled that the market is overbought, which is an obvious trend reversal signal. However, it is observed on the chart that the price maintained an uptrend after the overbought signal from the stochastic oscillator.
The obvious reason for this market action is that the price action still maintained a bullish sentiment, and that is paramount. Hence, the signal from the Indicator could not play out.
Q3b. Explain your understanding of divergences and how they can help in making a good trading decision.
Image| Forex.academy
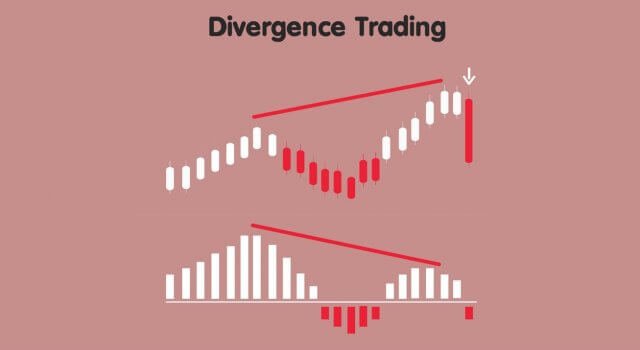
Oftentimes, when indicators' signals and the immediate price action do not go in sync, such occurrence is called a divergence.
Divergence defines a market situation where the current price of an asset moves in the opposite direction to what the technical indicator suggests. Severally, it has been witnessed how market Indicators would suggest a bearish/bullish reversal, and the price action does the exact opposite.
Market divergence is oftentimes dismissed off as a false signal. Although this is the case sometimes, they can signify something more. Most of the time, this divergence happens for a while before price action begins to tend towards the indicators' signal.
If price divergences are observed keenly, with the right combination of technical tools, they can be used to detect prices reversals at an early stage. An example of divergence can be seen in the chart below.
Q3c. Using relevant screenshots and an indicator of your choice, explain bullish and bearish divergences on any cryptocurrency pair.
Bullish Divergence
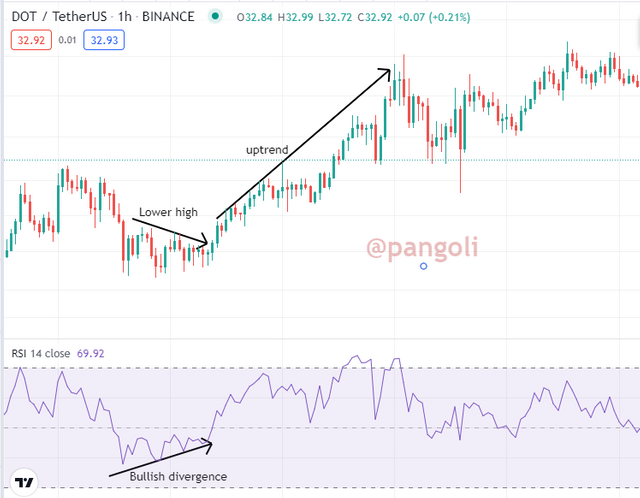
Image| Tradingview.com
Whenever prices fall to a new low, while an oscillator maintains some series of higher lows, it is described as a bullish divergence. The chart above illustrates what a bullish divergence is. The oscillator gives off an uptrend signal when it began to make some upward movement. However, the price action did not immediately follow suit. This diverging movement oftentimes precede the emergence of an uptrend.
Bearish divergence
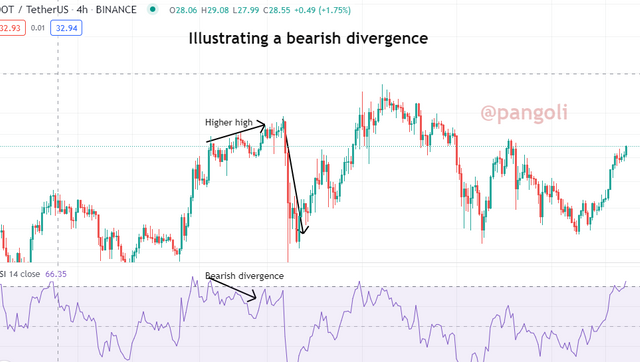
Image| Tradingview.com
On the reverse, bearish divergences occur when prices climb to new levels, making higher highs, while the oscillator barely gets to a new peak. On the chart above, we can observe a sell signal on the indicator window. However, the asset's price action goes temporarily in the opposite direction. A strong downtrend often results from this market situation.
Conclusion
Technical indicators are some useful tools for market analysis, and can be crucial in helping traders maintain a profitable streak. Given the two broad categories of leading and lagging indicators, it is crucial that traders understand the workings of these indicators, the best market conditions to use them, and how to apply them to their trades in order to maximize profits.
Thank you for reading...
Hello @pangoli, I’m glad you participated in the 4th week Season 4 of the Beginner’s class at the Steemit Crypto Academy. Your grades in this task are as follows:
Recommendation / Feedback:
Well detailed explanation on technical indicators. You have submitted a quality content and have explained every question in detail.
Thank you for participating in this homework task. I look forward to reading your next assignment.
Thank you, Prof. I sure will turn in my next assignment in time.