Trading with Accumulation / Distribution (A/D) Indicator - Crypto Academy / S4W5 - Homework Post for @allbert.
Hello guys...
I'm glad to have participated in this week's lecture about the A/D indicator. My answers to the assignment questions is presented below.
Q1: Explain in your own words what the A/D Indicator is and how and why it relates to volume. (Screenshots needed).
Oftentimes, we get to a point in the market when it seems like there is no serious activity anymore: prices do not rise above or fall beyond a certain range, and the impulsive moves that sparks the fun in the market seem to have varnished. The market bounces in a repeated sequence within a price corridor, and suddenly, boom! Price breaks out in one of two directions - either up or down.
The analogy above explains what a typical Accumulation and Distribution zone looks like. The consideration here is that whales and institutional traders/investors , who are able to push huge sums of money in and out of the market, do have certain zones where they settle to gather enough assets to maintain a profitable streak in the next market move.
In a typical Accumulation or Distribution zone, these large investors/traders buy/sell their choice assets in small quantities over a period of time before the retail investors join in.
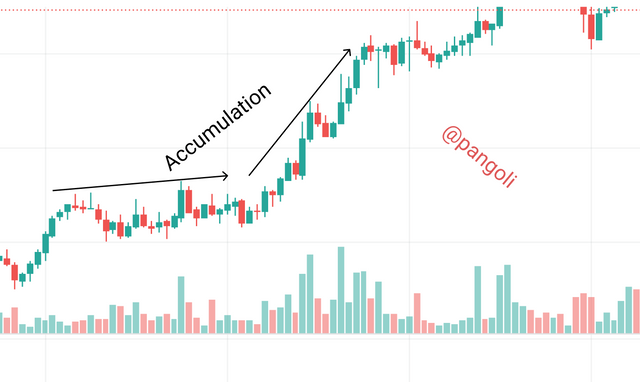
Accumulation phase
Screenshot| Tradingview.com
This has to do with the buyers. An Accumulation phase is a point in the market cycle where big investors gather enough equity to profit from an upcoming bull-run. At this point, the big investors (or smart money) begin to buy up an asset in tiny quantities such that it doesn't trigger any obvious bullish momentum in the market.
When they are done accumulating, they then make impulsive moves - buy in larger quantities- to invite the rest of the market to join the bull party, while they are already sitting on profits from the assets they accumulated.
This scenario increases the buying pressure in the market, thereby causing price to rally up in a random succession.
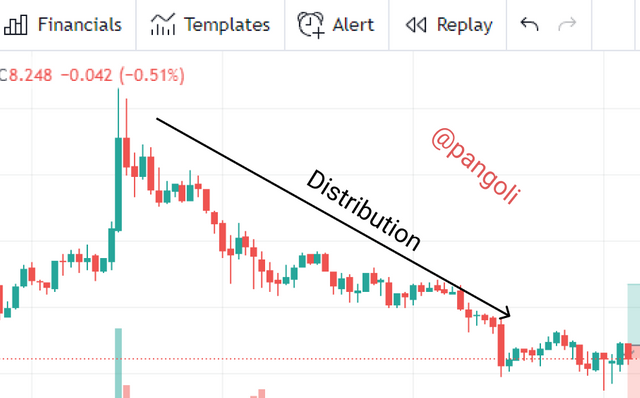
Distribution phase
Scrrenshot| Tradingview.com
Once the uptrend from the accumulation phase has gone sufficiently enough to earn the big investors their desired level of profits, they get to a point where they begin to "take profits."
At this point, just like it happened in the early accumulation phase, these investors begin to sell off their assets in small quantities while the rest of the market keeps buying in expectation that price will keep going up. The small "sell" quantity makes the fact that big investors are taking profit difficult for other market participants to see. This is the " early Distribution phase."
Once the big investors have realized enough profits, they begin to sell off in larger quantities. The rest of the market becomes aware and joins them, resulting in a persistent price decline, leading all the way down to another accumulation phase.
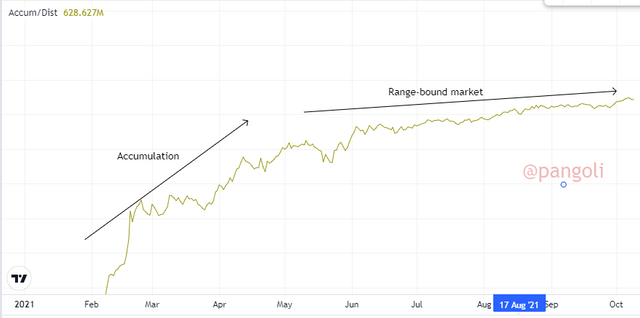
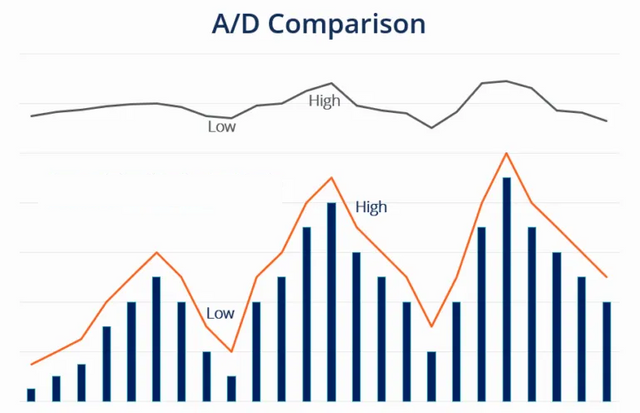
What the A/D indicator is
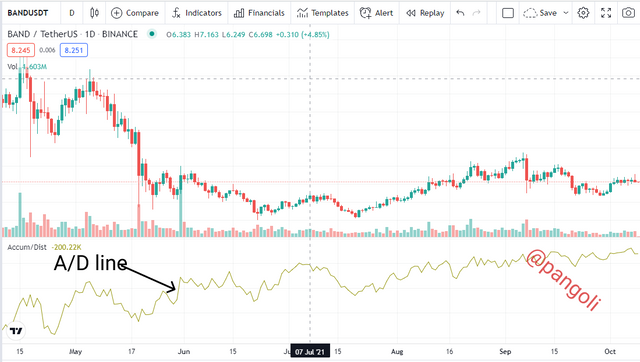
Screenshot| Tradingview.com
The A/D indicators takes the above context -the Accumulation and Distribution phase of the market - into consideration and presents an indicator that makes it easier for anyone to know when the market is in either of these phases.
Particularly, the A/D Indicator tells us where in the market cycle we are -Accumulation, Uptrend, Distribution, or Downtrend - and delivers market signals that help traders/Investors make the most out of each phase of the market cycle.
The A/D line as shown on the graph above can move in tandem with the price action- up and down - to indicate the strength of a market trend; or it can go in opposite direction to the trend, indicating a divergence and a low volume behind the current price action.
How it relates with volume
Image| corporatefinanceinstitute.com
The A/D indicator pulls data from the trading volume and price of an asset to assess whether it is being accumulated or distributed.
Usually, the market volume is said to support the current market trend if the A/D indicator and the current market trend goes in the same direction. Here, it is believed that the trading volume of the asset is enough to sustain the prevailing market trend at the time.
On the other hand, if the A/D Indicator and the current market trend are going in opposite direction, it indicates that the market trading volume is not enough to sustain the current trend; and it indicates that the market could soon reverse in the direction of the A/D Indicator.
Q2: Through some platforms, show the process of how to place the A/D Indicator (Screenshots needed).
For my illustration, I will use the TradingView platform to add the A/D Indicator to a cryptocurrency price chart using the following steps:
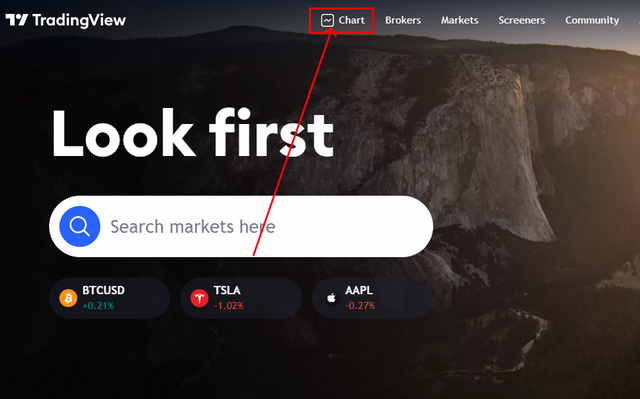
Image| Tradingview.com
- Launch the TradingView.com platform and click on "charts" on the homepage. On the resulting chart interface, pick an asset of choice.
In my case I chose the BAND/USDT pair
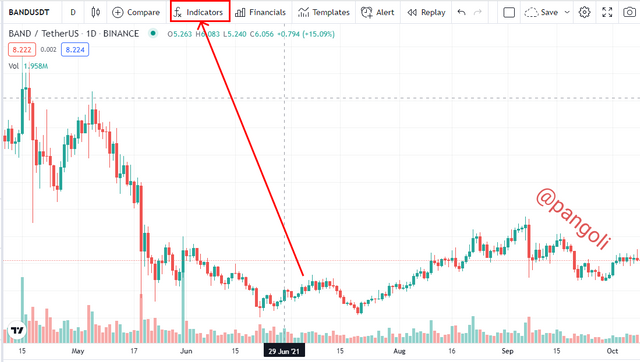
Image| Tradingview.com
- Proceed to add the A/D indicator by clicking on the Indicator icon at the top of the screen
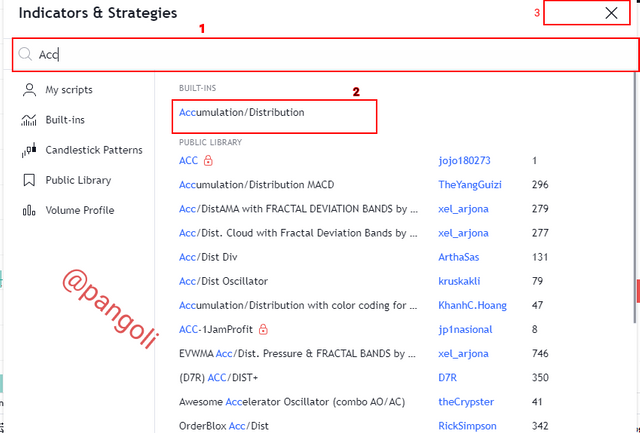
Screenshot| Tradingview.com
- In the search box type "Accumulation/Distribution" and click on the first option on display. Then close the Indicator window.
Screenshot| Tradingview.com
- The indicator gets added to the price chart.
You can proceed to modify it to suit your preferences. I used mine in the default setting.
Q3: Explain through an example the formula of the A/D Indicator. (Originality will be taken into account).
The formula for computing the A/D indicator utilizes data from the price and trading volume of an asset. According to investopedia.com, the formula to compute the A/D line is divided into two:
- Money Flow Multiplier (MFM)
MFM = ((Close−Low)−(High−Close))/(High - Low)
Where:
Close = closing price Low = Period's lowest price point High = Period's highest price point
- Money Flow Volume (MFV)
MFV = MFM × Present period's volume
Then,
A/D = Previous A/D + CMFV
where:
CMFV = Current period money flow volume
Illustration
The following are parameters obtained from the BAND/USDT pair (1 hour timeframe)
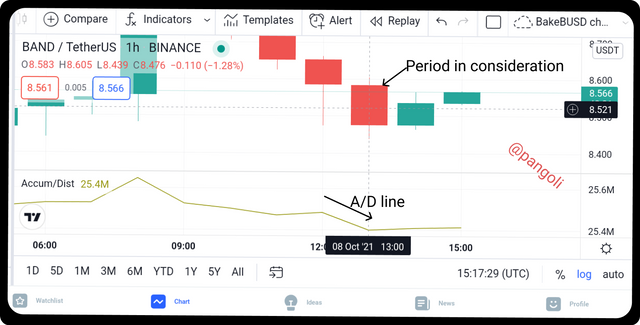
Screenshot| Tradingview.com
From the screenshot,
High = 8.605, Low = 8.439, Close = 8.476, Volume = 152227, Previous A/D line = 25485000 = 25.485M
Applying the formula above:
MFM = ((8.476 - 8.439) - (8.605 - 8.476))/(8.605 - 8.439) = (0.037 - 0.129) / 0.166 = - 0.092/0.166 = - 0.740
Hence, Money Flow Multiplier = - 0.740, this indicates that the resulting line will slope downwards.
MFV = MFM × Volume = (-0.740) × 152227 = - 118296.848
Since we've obtained the money Flow Volume, we simply combine both components to obtain the current A/D line,
A/D line = Previous period's AD + Current MFV = 25486000 + (-118296.848) = 25.4M (approximately)
We can see that the value above rhymes with the resulting A/D line of the current period on the screenshot below.
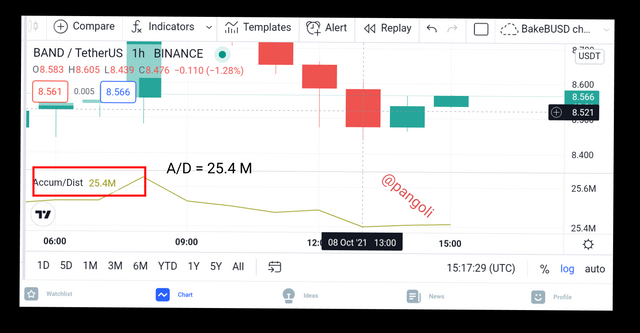
Screenshot| Tradingview.com
Q4: How is it possible to detect and confirm a trend through the A/D indicator? (Screenshots needed)
With the A/D Indicator, it is very easy to confirm a trend. This is because the Indicator follows after the trails of price action.
Screenshot| Tradingview.com
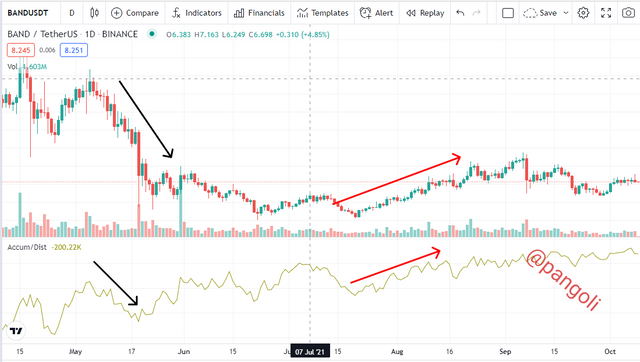
It is common to find the A/D indicator trending upwards in an upward trending market, and vise versa. The movement of the A/D Indicator oftentimes mirror price movement. The following screenshot Illustrates how the A/D Indicator can be used to confirm a market trend:
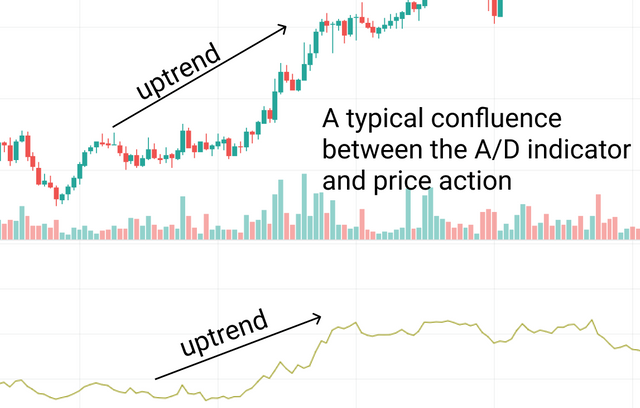
Screenshot|Tradingview.com
Here, we can see that the market is trending upwards and this is confirmed by the A/D Indicator. Hence, the trend is believed to be a strong one, as the confluence between price action and the A/D Indicator shows that the buying pressure/volume is sufficient enough to sustain the current market trend.
Conversely, when the market is trending downwards. The move often gets confirmed by the A/D Indicator and we can conclude that the pressure/volume behind the current market trend is enough to sustain the bearish momentum.
Q5: Through a DEMO account, perform one trading operation (BUY or SELL) using the A/D Indicator only. (Screenshots needed).
For this Illustration, I will be doing a transaction on the BAND/USDT pair. First of all, I will do my Analysis on the TradingView charting platform as captured below:
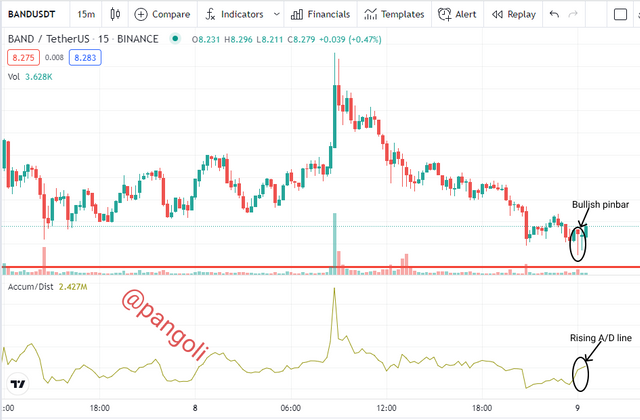
Screenshot| Tradingview.com
On the 15 Minutes time-frame, we can see a bullish pinbar on the price window, followed by a rising A/D indicator. This means that the market is about to do an upward rally. As there is a confluence between price action and the A/D indicator, the signal is a reliable one. So I will proceed to find an entry point as well as set my risk-reward ratio.
Screenshot| Tradingview.com
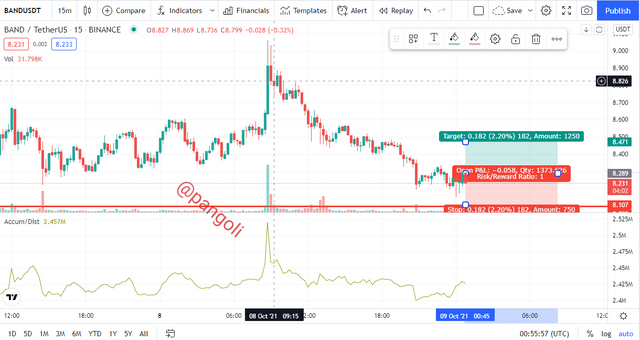
As displayed on the screenshot, I entered my trade using a risk-reward ratio of 1:1. And so far, the market has gone against my prediction. There is a temporary draw-down, but I expect the price to reverse back up after the pull-back.
Screenshot| Tradingview.com
Q6: What other indicator can be used in conjunction with the A/D Indicator. Justify, explain and test. (Screenshots needed).
It is a general rule of thumb that no Indicator provides very accurate results when used in isolation. Hence, the A/D indicator can do better in terms of accuracy if paired with some other indicator.
Since the A/D indicator is a trend-following Indicator, that is, it follows after the price action; I would pair it up with a leading Indicator - one that precedes the price. Leading indicators give signals before the price reacts.
My choice would be the Relative Strength Index (RSI) Indicator because it gives reveals important information about the market. Key information like overbought and oversold regions, trend direction, trend divergence, are captured by the RSI indicator.
Illustration
Let's pair up the A/D indicator and the RSI indicator to see the clarity they bring into market analysis:
On the TradingView.com platform, I followed the same steps detailed in Question 2 above to add all my indicators to the price chart.
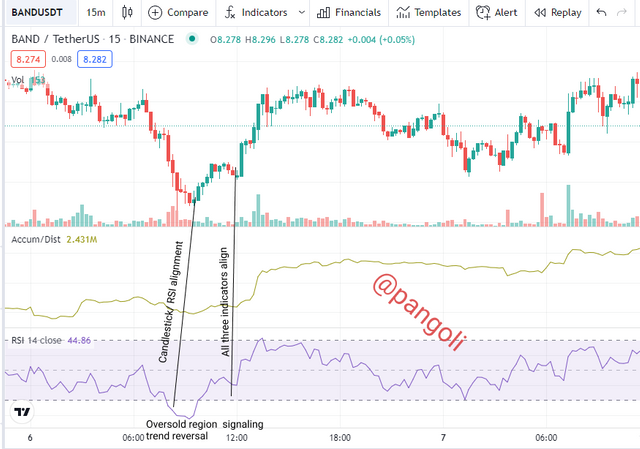
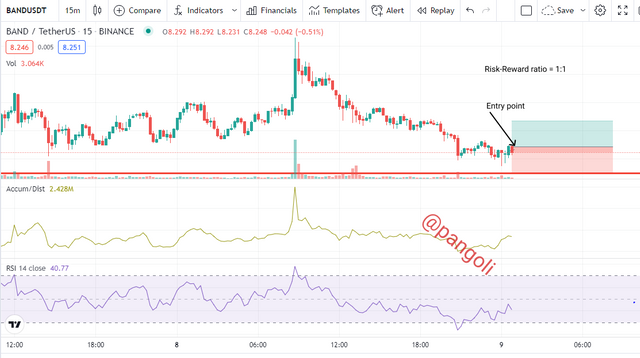
Screenshot| Tradingview.com
From the chart, we can see a confluence between the three charts at the point where vertical lines are drawn. The leading indicator- the RSI- signals that the market is oversold, and price responds to it by doing a few candles up. The bullish trend finally gets confirmed by the A/D indicator at the second vertical line where all three indicators give off a bullish signal. This implies a strong momentum, and further validates the investor's/trader's decision to buy.
Conclusion
Understanding the behaviour of market participants at each point of the market cycle is a significant skill for any trader/investor to acquire. Interestingly, market indicators like the accumulation and Distribution indicator goes a long way to make the learning process easier.
Understanding the A/D indicator and how it applies in different market conditions, and also knowing the right set of indicators to pair up with it, can help a trader/.investor make informed decisions in the market.
Thank you for reading...