Crypto Academy / Season 3 / Week 7 - Homework Post for [@yousafharoonkhan]: How to create an account on TradingView & How to use the indicators, tools and features of TradingView
Homework week-7 :
Question no 1:
Defining the TradingView site and how to register an account in tradingview? what are the different registration plan?(screenshot necessary)
Defining TradingView in a simple and concise way, we could say that it is a social trading platform that makes mechanisms, tools and information available to all its users to carry out their trading analysis.
TradingView allows us to know and analyze information on any class of assets, from commodities, to currencies and cryptocurrencies and others.
TradingView has so many resources available for trading analysis that it has deservedly earned a reputation and the position of being the best option (or one of the best) in that regard. Because doing chart analysis accurately and systematically is an important issue when trading, and TradingView makes life easy for all traders in that sense due to its design, simplicity, and huge number of features.
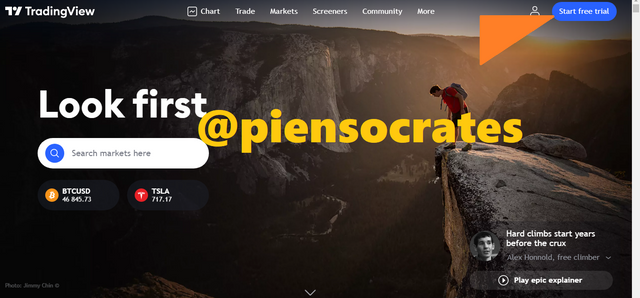
This is what the tradingview platform looks like when accessing it.
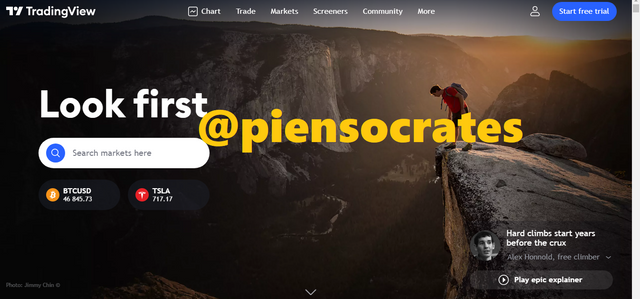
To register, click the Start Free Trial button.
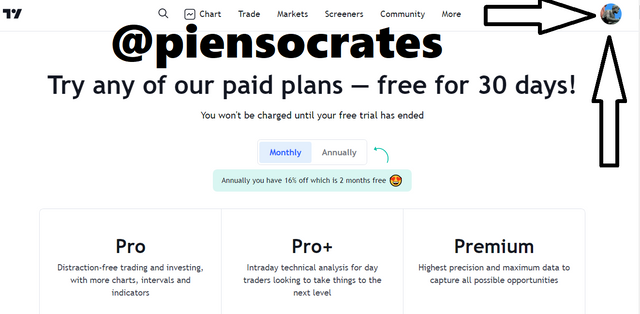
First, in the section we get to, we see all the plans they have available if we want to pay for their services (which we must do depending on the use we want to make of the platform and our needs as traders).
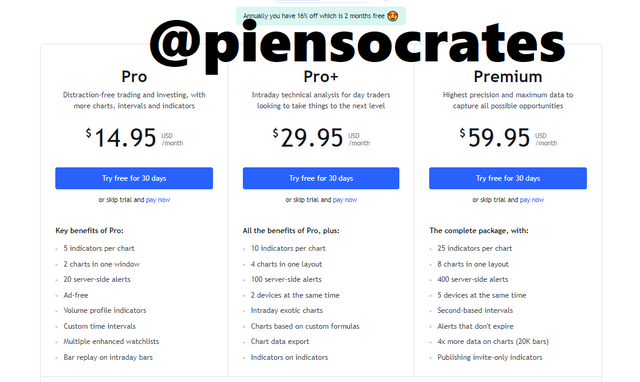
But if we only need to give it a basic and elementary use, it can be enough simply to use the free version.
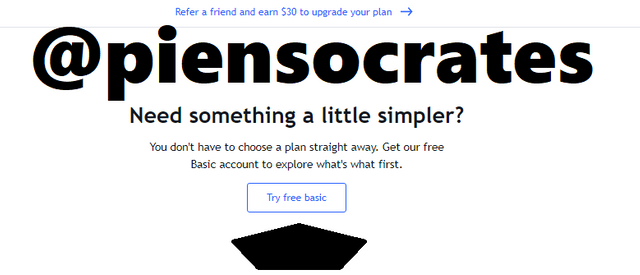
To access its basic services for free, we just go down a little in the window and press the button Try Free Basic.
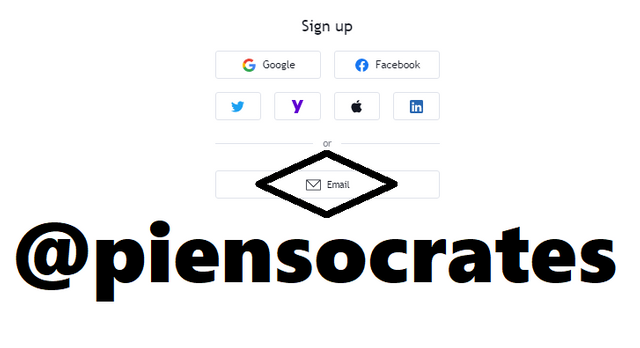
Then we will see a series of options through which we can register in TradingView. We see that most of them are to register through social networks, but today I will register through my email.
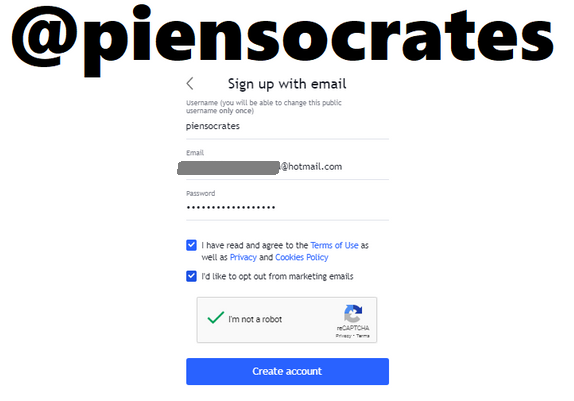
I choose my username, enter my email address and put a password with which I will log in when I go to TradingView
(by the way, we need to solve the captcha too).
After that, I confirmed my account through the link that came to my email, and now I can access TradingView. Now we are going to put our image profile, name and surname y click on Continue.
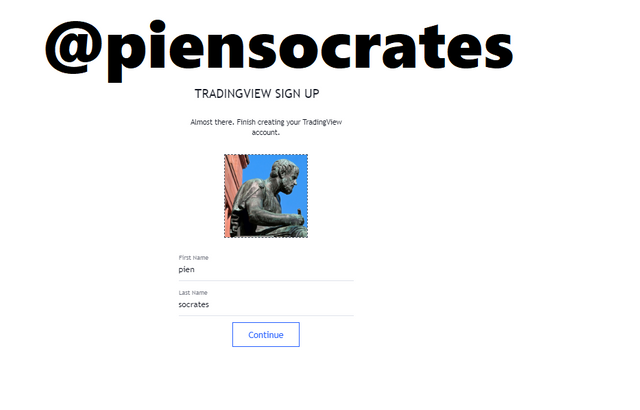
And as you see below, Now I'm already an user of TradingView.
With this I have already logged into my TradingView account and now I can access the free basic features of the platform.
Question no 2:
Explain the different features of TradingView and what is your favorite feature and why?(screenshot necessary)
TradingView features are as follows:
1. Prices Lists:
TradingView allows us to view the asset price charts with prices updated in real time, second by second, provided by the most important brokers and exchanges worldwide.
2. Alerts:
TradingView allows us to create alerts so that the system warns us whenever the price levels that we establish of importance for an asset occur.
3. Charts:
In TradingView, with charts and by using indicators and tools, we can effectively perform our technical analysis of the markets.
4. Social:
TradingView offers sections for social interaction; analysis, market impressions, news and more are shared.
5. Wachtlists:
TradingView allows us to create asset tracking lists, for example, suppose I need to be aware of the price of Bitcoin, ADA, STEEM, TRON, Ethereum and 5 other cryptocurrencies, because I can put together a list for it.
6. Desktop app and mobile app:
We can access our TradingView account through our mobile or our computer, because it give us access in both ways.
What is your favorite feature and why?
Well, my favorite TradingView feature is one that I haven't told you about yet; I mean the meter function of the market.
Every time we visualize the price chart of a cryptocurrency (or any other asset), there is a kind of meter with a needle indicating what is happening in the market at that moment, and what is best to do.
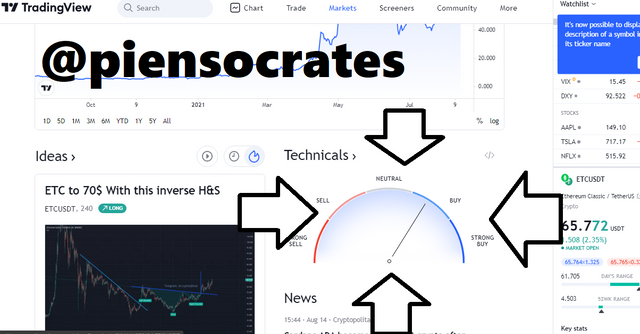
I like it because it guides directly on what is best to do at that specific moment; For example, the needle may mark "Buy" which means it is time to buy or a good point to do so. Or the needle may point to "Sell", which will let us know that we should sell or that it is a good point to start analyzing whether or not we should sell.
Question no 3:
How to set up a chart in TradingView and use two tools to edit it.(screenshot necessary)
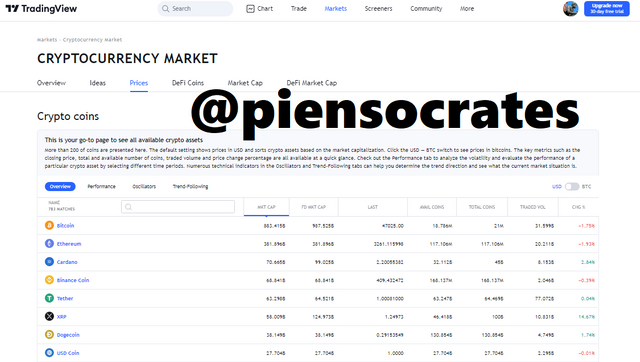
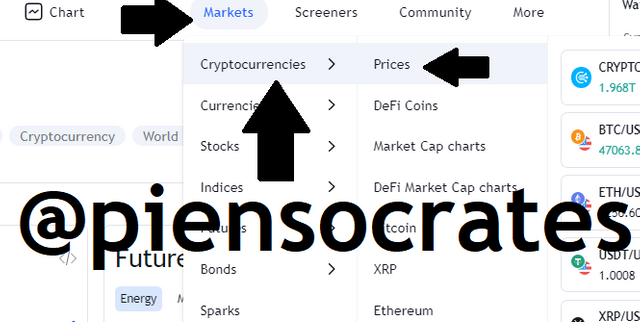
Let's put the hypothetical case that I want to see the graph of a cryptocurrency, for this I must click on Markets, then on cryptocurrencies and then on Prices.
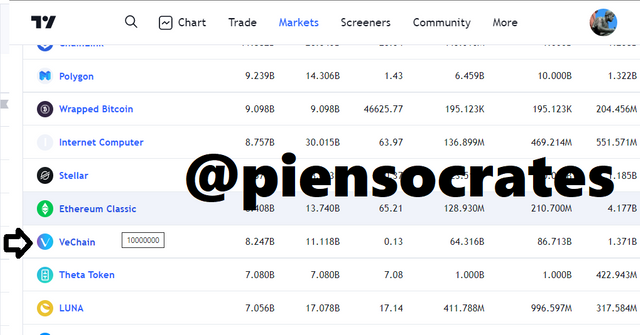
Then we come to the list of cryptocurrencies. Let's take the hypothetical case that I want to visualize the VeChain graph, then I click on it.
I get to the next section.
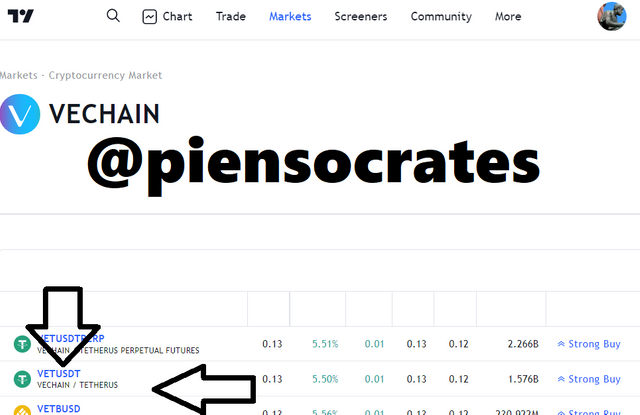
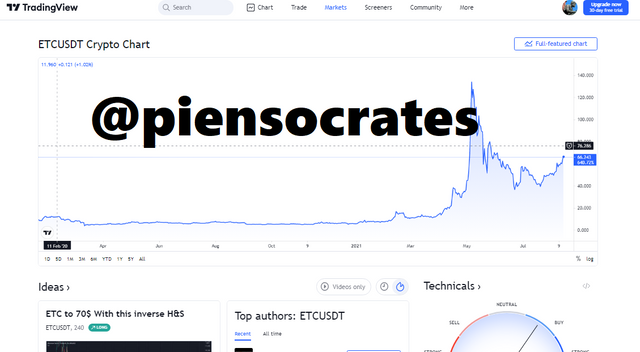
I want to specifically visualize VeChain / Tether, so click on pair VET/USDT; and I get to the next section.
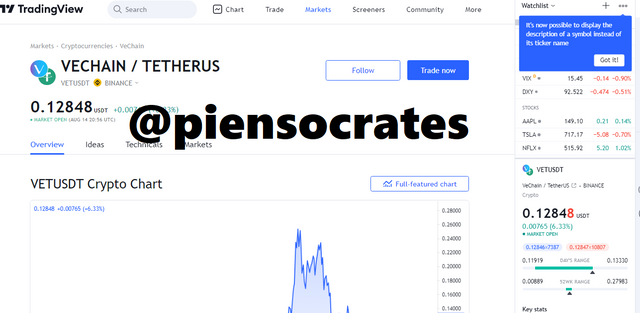
The chart that I show above is the initial form as we see the graphs, but we need the graph to be seen in the way that allows us to add indicators and use the drawing tools that the platform makes available to users. Therefore, you must click on the button that says Full-featured chart.
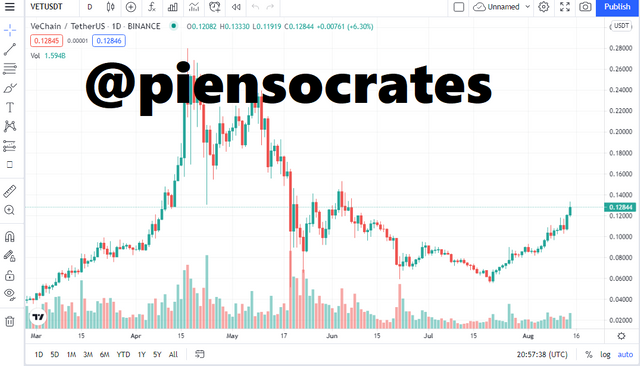
As you can see in the image that I just showed you, now the graph of the VeChain cryptocurrency is ready so that I can do my respective technical analysis in TradingView before going to trade on my favorite exchange or broker.
Using tools to edit it
Knowing how to edit the charts using the tools is one of the most useful and relevant things that we must take into account in TradingView during our technical analysis, so let's see.
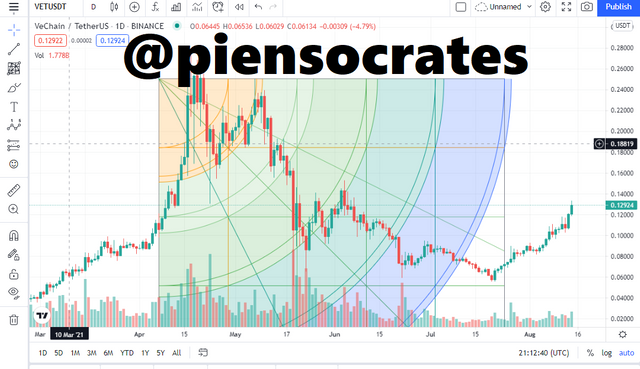
TradingView's drawing tools are in a bar located to the left of the asset charts when we are analyzing them. Suppose I want to add a "Gann Square", for this I must click on the "Gann Square Fixed" drawing option and select "Gann Square".
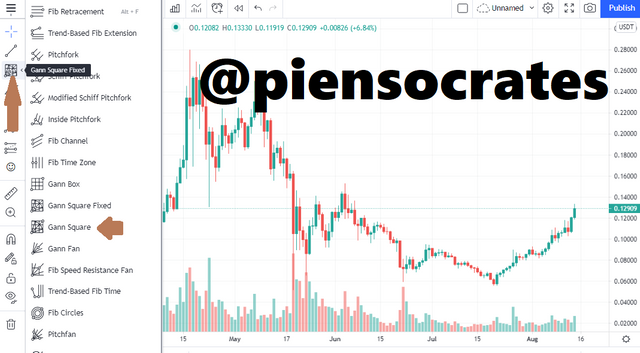
Once I select it, I just project it onto the graph in the way that I know or intuit appropriate, and it will look similar to the graph you can see below.
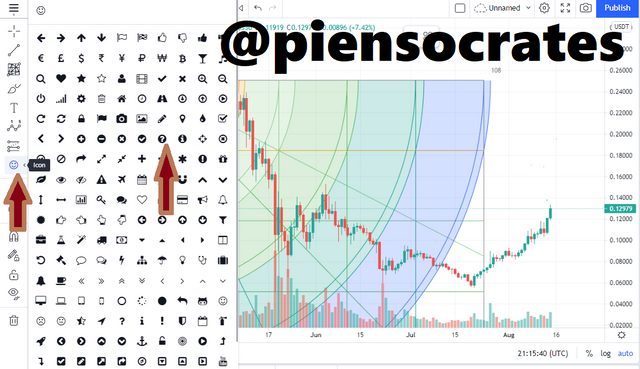
But there are many, many more tools that we can use in the analysis of our tradingview charts, let's take the example that I want to put a question mark on the chart that I just showed you. To do this, click on the icon of the tools that has the smiley face (the one with the smiley emoji), and I choose the question mark option that I mentioned.
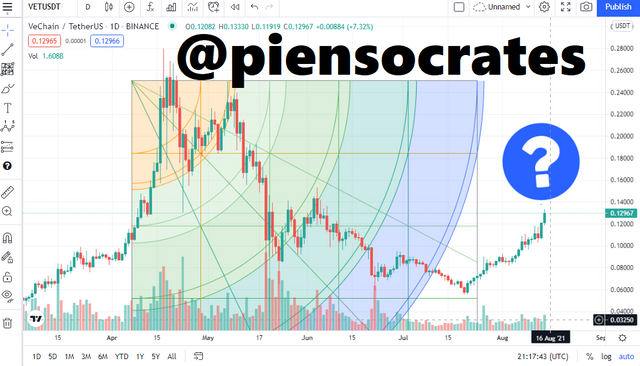
Then I just click on the graph at the point where I want the symbol to be, and I make it bigger or smaller as I decide. And looks as below.
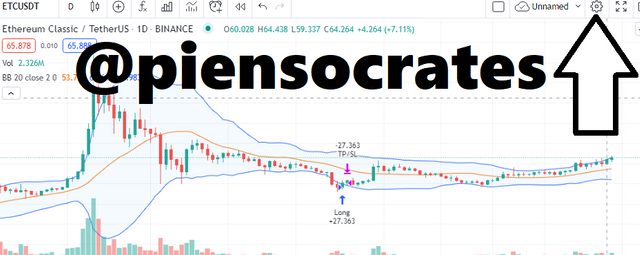
We can also edit if we want, the background color of the chart, the color of the bars, the shape of the candles, etc. Doing it is very easy, and very intuitive, although it is something that is rarely used; In any case, if you want to do it, you just have to click on the image of the nut and there you will already know what to do with just a little exploration.
Question no 4:
Explain how to add indicator in chart, what is your your favorite indicator and why? (screenshot necessary)
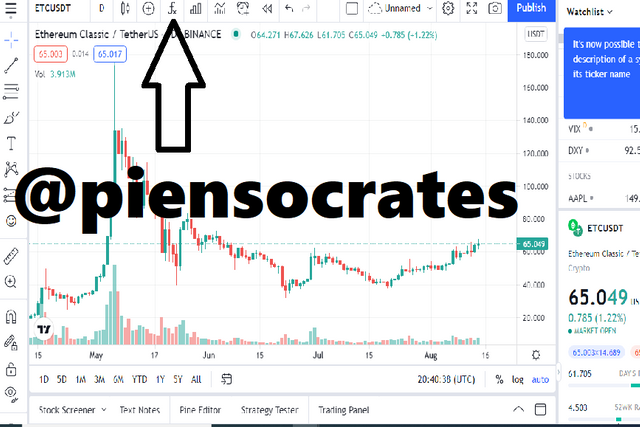
To do this, we open the graph of the cryptocurrency that we want to analyze.
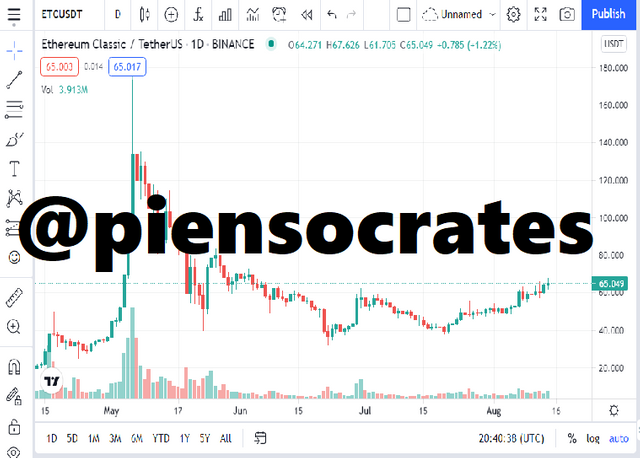
Then I click on the indicator option, as in the image below.
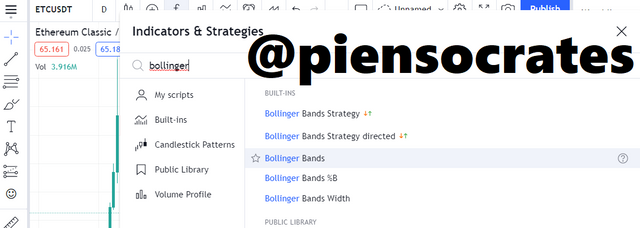
Then I write the indicator I am looking for, in this case I will search to put the Bollinger Bands, and it immediately appears, and I must click on it.
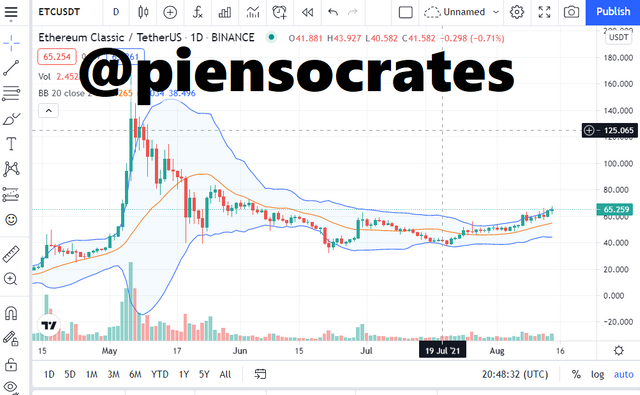
When I do it, they are already visible to me in the graph, as you can see below.
What is your your favorite indicator and why?
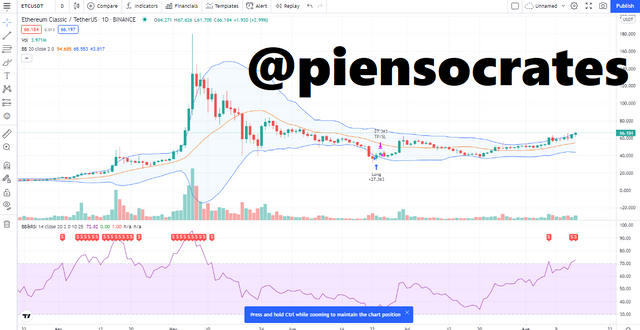
I can say that my favorite indicator is Bollinger Bands with RSI (you can see the mentioned indicator below):
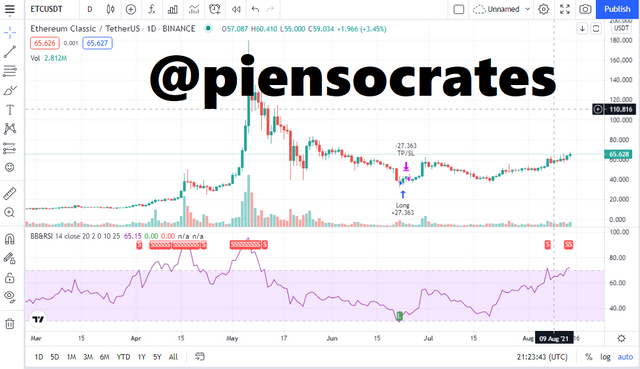
The reason is very simple, I like to trade (for my trading strategy) when the prices touch the Bollinger bands and the RSI marks me points of overbought or oversold respectively.
Let me explain, when the price of a crypto is touching or crossing down the lower band and the RSI marks me an oversold point (when it protrudes down), I usually buy. And also, when the price of a crypto is touching or crossing up the upper Bollinger band and the RSI marks me overbought, then I usually sell.
I use this method and indicator because it is the one that has given me the best results in my trading operations in particular and because it works really well for any asset and timeframe that we want.
Question no 5:
Do you think TradingView is useful in predicting the market for cryptocurrency (trend / price)?
Although TradingView, directly, does not predict prices of anything, it provides us traders with high-level and accuracy data and tools that allow us to make accurate analyzes of market situations and that is truly remarkable for this platform, because it allows us to make accurate predictions or projections for our trading operations.
I know many trading analysis platforms, and I can say that as far as I know, TradingView is the most complete of all that exist, due to this, it is the indispensable analysis tool for everyone to perform accurate analysis and accurate forecast of any market.
Conclusion
TradingView can be considered as a specialized trading analysis tool. The level and quality of technical analysis that we can carry out thanks to this platform is of a high level (of the highest level).
And although it is true that if we do not pay for the most advanced use capabilities of the platform we cannot access the most advanced features of it, it is also true that being retail traders, or people who operate at a low level of use and requirement it may be more than enough to us the free option of TradingView to work.
In my view, the most notable thing about the limitations of the free option is that only three indicators can be displayed per chart, but over time we learn that simplicity is the most important thing when analyzing and trading in the markets, so I repeat, in my view, this is more than enough in this regard.
Well, this is my participation in the Crypto Academy, in this seventh week of the third season, and doing this task for @yousafharoonkhan (Pakistan) Until next time!
Respected first thank you very much for taking interest in SteemitCryptoAcademy
Season 3 | intermediate course class week 7
thank you very much for taking interest in this class,