Crypto Academy Week 15 - Homework Post for [@yohan2on]: The Swing Trading Style
As we well know, in the world of trading there is daytrading, swing trading, etc. Depending on our temperament (if we are impatient, calm, proactive, etc.), we can choose one type of trading over another, although technically all have their benefits and risks, even if we become experts in the trading modality we have chosen.

Image designed by me
Swing trading is an interesting way to trade, because it involves prior analysis of time slots that then do not require permanent attention to the price charts of the asset markets. If you are a swing trader and you are operating in the spot market, then you establish a purchase point and place a limit order; if happen, then you'll buy automatically, otherwise, nothing happens. On the other hand, if you are marging trading, then you set take profit and stop loss points, based on the resistance and support points that you have previously defined in the analysis.
But let's talk now about the prior analysis necessary to perform swing trading.
Logically, we need to do technical and fundamental analysis to doing swing trading, and analyze different time frames before launching into doing anything in the markets.
We first choose an cryptoasset (say, the VET / USDT pair), and then we go to the analysis charts. We then visualize the graphs in monthly, weekly, daily, 4-hour periods, etc., identifying the underlying trends in each of them.
In this process, we also define the directionality of prices based on other technical indicators (such as moving averages). and we also define the most probable support and resistance points. In technical analysis, in addition to using various indicators, we can be guided by analysis of the candlestick patterns as well, for a better operation.
Swing trading method shown through an example:
Let's analyze the current chart of the aforementioned VET / USDT pair:
But before we see the graph, let's visualize that according to Coingecko, VET is worth $ 0.098518 approximately right now (and I say approximately, because the price changes every second, as we all know).
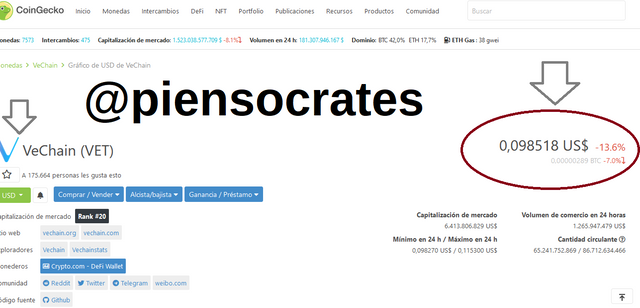
VET price display on the Coingecko platform
To define the trend in the graphs of different temporalities of this cryptoasset, I start with the monthly graph, define the ema indicator (or exponential moving average) and configure it as follows: I place two averages, one first I set it to 34 periods and I define it with a dark green color and a thick line. The second mean, I just define 12 points, I put the line in blue and the thickness of the line I set a little thinner than the previous one. I also place the Bollingers Bands indicator for the analysis.
With all of the above, I can already see the underlying trends in each time frame to review, now I need only review them and establish the possible resistance and support points based on the action of the candles.
I define the resistance points with a green line and the support points with a red line.
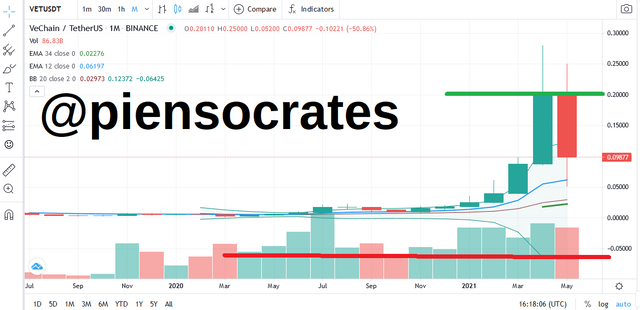
Graph of the VET / USDT pair visualized through tradingview on the Coingecko platform. Monthly time frame
In the timeframe (that is, in the monthly timeframe) from what I can see, I locate the resistance zone at the $ 0.20 point and the $ 0.06440 support zone, and we can see the trend is bullish.
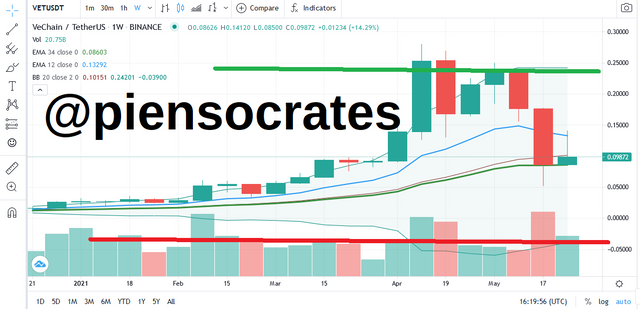
Graph of the VET / USDT pair visualized through tradingview on the Coingecko platform. Weekly time frame
On the weekly time frame chart I locate a bullish trend or directionality, with a support point at approximately $ 0.08527 and a resistance point at approximately $ 0.25329.
Now let's look at the daily time frame:
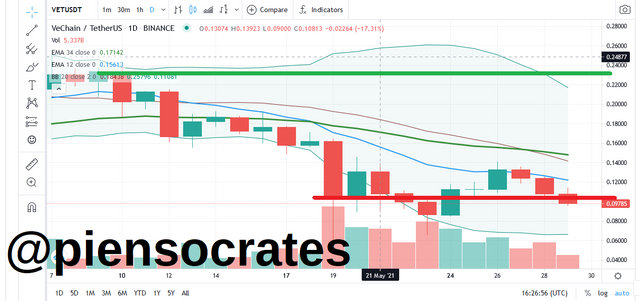
Graph of the VET / USDT pair visualized through tradingview on the Coingecko platform. Daily time frame
And there we note that the timing is bearish, with a possible resistance point at $ 0.23214 and a probable support point of $ 0.10586.
Now let's take a look at the graph in a 4 hour time frame.
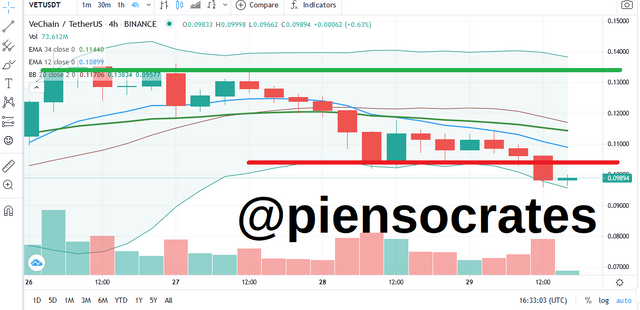
Graph of the VET / USDT pair visualized through tradingview on the Coingecko platform. 4H time frame
What we can see in the 4-hour chart is that the price is in a downtrend for that time frame, and that the possible resistance point is located at $ 0.13432 and the possible support point at $ 0.10378.
Schematic analysis
TimeFrame: Monthly---> Trending: Bullish--> Support point: $ 0.06440 Resistance point:$ 0.20.
TimeFrame: Weekly---> Trending: Bullish--> Support point: $ 0.08527 Resistance point: $ 0.25329.
TimeFrame: Dayly---> Trending: Bearish--> Support point: $ 0.10586 Resistance point: $ 0.23214.
TimeFrame: 4 Hours---> Trending: Bearish--> Support point: $ 0.10378 Resistance point: $ 0.23162.
Reasons for my entry
Based on the schematized analysis of the situation, I could see that the trend is upward, in the two charts with the longer time frame, and downward in the two charts with the shorter time. Technically I think it will go higher, but since the markets are unpredictable and there are two time frames talking about possible reversals, I would set my take profit at $ 0.23 and my stop loss at $ 0.0985 in this case, with trailing stop loss in $ 0.15..
Of course, what is explained is in terms of margin trading, but in spot trading, what I would do is enter at the current point of 0.0985, leaving a limit order taking profits also at the point of $ 0.23 and that would give me a profit of $ 0.1315 per unit of VET you have purchased. In which case, suppose I bought 1000 VET, which would have cost me $ 98.5 (at a price of 0.0985 per unit) and withdrawing profits at $ 0.23 per unit, it will give me gross profit of $ 230; with a total net profit of $ 131.5 in the proposed scenario.
Well, this is my participation in the Crypto Academy, in this week 11, and doing this task for @yohan2on (Uganda). Until next time!
Hello @piensocrates,
Thank you for participating in the 7th Week Crypto Course in its second season and for your efforts to complete the suggested tasks, you deserve a 7/10 rating, according to the following scale:
My review :
An article with good content, as I clearly addressed the topic, especially trading in different periods of time and using an indicator for technical analysis. It lacks the extraction of several signals using different indicators.
Thanks again for your effort, and we look forward to reading your next work.
Sincerely,@kouba01