[Basics to trade cryptocurrencies correctly, Part 1] - Crypto Academy / S6W1 - Homework post for professor @nane15

Without wasting much of our time, let me quickly proceed with the given tasks.

QUESTION 1
The act of trading is as old as communication itself. Trading is simply an act of exchanging goods and services with the aim of making profit.
The origin of trading is dated as far back as 3000BC when the materials used in modeling jewelry are traded in Egypt.
Trading has been an activity that occurs among those living in a concise location until the first long-distance trade occurred between the Sumerians in Mesopotamia and the Harappan civilization of the Indus Valley in the 3rd millennium BC.
Ever since trading and currencies have evolved to the point of going digital and that's what we will be talking about in this lesson.
Trading as we have already known is the act of buying and selling assets with the sole aim of making a profit. These buying and selling of assets are based on the analyzed prediction that the said asset has a high tendency of declining in value thereby making a trader sell in other to secure profits and buy back when the asset is speculated to increase in value.
This act is usually carried out on centralized or decentralized exchanges which provide liquidity as well as tools suitable to aid traders in properly analyzing the price movement of various assets of choice before making a trading decision and in turn, a trading fee is charged by the exchange on any successful trade implementation.
There are many factors to be considered before carrying out a successful trade and these factors include; market emotions, price action, and other related trading information.
The above-listed factors can be summarized into three trading analyses which are, fundamental analysis, sentimental analysis, and technical analysis.
Fundamental analysis deals majorly with the available information regarding a particular tradable asset such ad its supply, size of the community, market cap, trading volume, and other necessary information.
While that of sentimental analysis deals with information on social media, news headlines, and other social-related information that tends to affect traders' emotions and psychology. This in turn leads to various decision-making as regards trading.
Coming to technical analysis, it deals with the proper interpretation of asset price movements as represented on price charts. Different techniques are applied when it comes to technical analysis and they include, the price action technique and the use of technical indicators.
Price action technique deals with the careful study of price chart and interpretation of market movement and formations as represented on the price chart.
These include primarily the proper identification of higher highs and lows, resistance and support areas, and other chart patterns without the addition of technical indicators.
While on the other hand, the use of indicators on technical analysis makes the above-listed information easy to identify, and in addition other factors which affect the price movement of assets such as its volatility, volume and momentum can be properly identified using these technical indicators.
The exchanges on which these trades are carried out provide traders with these valuable tools suitable to properly analyze the market before making a trading decision in other to maximize profits and minimize loss.
QUESTION 2
The cryptocurrency market which is volatile is controlled by very large holders known as whales whose effect of buying and selling activities are usually felt in the entire market.
These whales are known as the big hands while retail traders who make profits by carefully analyzing the market movement in other to either buy or sell are known as the weak hands.
- THE STRONG HANDS
The strong hands are commonly known as whalescomprises of large trading companies, banks, and other organizations or individuals with huge trading capitals.
These whales do not need to perform a series of analyses before entering the market because their position is large enough to move the market to any direction of choice thereby preying on retail traders to generate liquidity.
- Screenshot
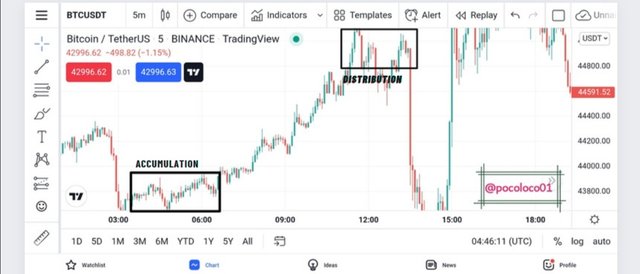
Looking at the above screenshot, we will see two important areas marked out with accumulation and distribution.
The accumulation area indicates that the strong hands are already accumulating the assets at a low price which leads to a sideways trend (ranging market).
This sideways trend will psychologically affect retail traders into believing in a bullish trend reversal especially when the previous trend is a bearish one.
This in turn will lead them into closing their open sell positions with the majority closing at a loss or minimal profits. On closing the sell positions, that leaves the majority of open positions on the buy-side thereby leading to an increase in asset price.
By the time the retail traders start to open buy positions, the strong hands have already started taking profits which leads to price reversal and accumulation of losses by most retail traders. This point is called the point of distribution because the price tends to reverse after the retailers must have opened positions at a high price. The unending circle keeps reoccurring thereby giving rise to up, down, and sideways trends.
- WEAK HANDS
This set of traders is low capital traders also known as retail traders. They include you and I and every other trader who trades with a low amount of capital when compared to that of whales.
The weak hands are mostly those that generate profits for whales by mainly falling for their manipulations.
This set of traders trades based on various trading analyses such as fundamental, technical and sentimental of which these analyses are mostly based on the effect of whales.
When the strong hands enter the market leading to a change in the market trend, the weak hands interpret it as a buy signal thereby closing their initial sell positions which in turn causes an increase in asset price. By the time these retail traders start entering the market, the whales who are already in profits start to close their positions which leads to a drop in price thereby signaling retail traders on a possible bearish movement which in turn leaves them with no choice of closing their buy positions in losses and low profits.
QUESTION 3
The cryptocurrency markets is mostly controlled by emotions of traders which is what lead to the emergence of fear and greed index.

These emotions are backup by sentiments which usually come are as a result of hypes from different social media platforms such as Twitter, Tiktok, Reddit, etc. These hypes are usually given out by influencers and deep-pocket investors who usually buy at low prices before creating hypes which get on the emotions of retail traders thereby making them FOMO into an already moving market.
Sentimental trading doesn't always end well and most times it's hard to resist because the news always tends to cause a spike in the price thereby making more retail traders FOMO in with the mind that the price will maintain the up movement. This allows big pocket investors the opportunity to close at huge profits thereby causing the price to pull back and leaving small investors in losses.
The above is what usually causes the long shadows we usually see on candlesticks after a spike and pullback of a bullish or bearish candle.
- Screenshot
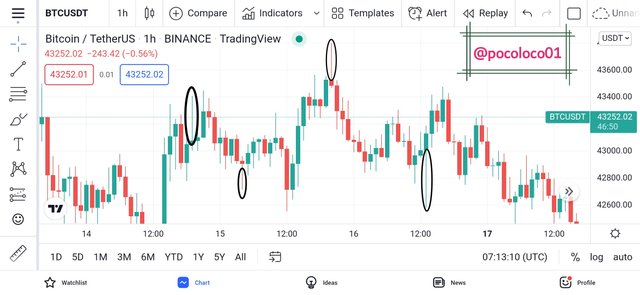
Looking at the above screenshot, we will see the evidence of Whale's manipulations that causes retail traders who out of emotions, sell at low prices and buy at high prices thereby losing money. These manipulations can be combated only if weak hands can learn to ignore their emotions and think like a pro.
QUESTION 4
Trend direction is actually one of the most import factors to be considered before making a trading decision in other to avoid counter-trading.
Trading against the trend is very risky and for that reason, different methods of identifying trends have been developed in other to aid traders.
Some of these methods include; the price action technique which is the formation of higher highs and lows, the use of trend indicators, the Elliot waves pattern, and several other techniques.
Here I will be talking about trend identification using the Elliot waves pattern.
Elliot waves pattern is simply the repetitive movement of market trends caused by traders' emotions and psychology. It comprises the impulse and correction waves which can be identified on the market chart.
The Impulse wave formation serves as trend identification thereby aiding a trader to trade according to trend direction. On the other hand, the correction waves form opposite to the impulse waves thereby serving as trend reversal pattern that aids a trader to know when to exit the market.
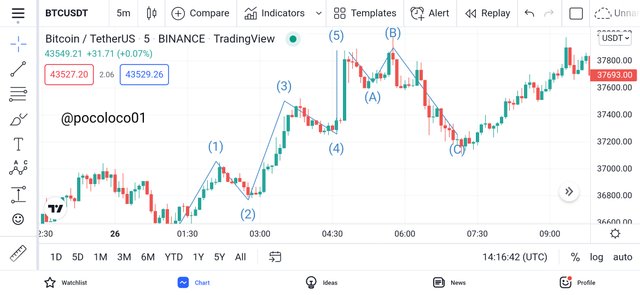
- See pattern below
.png)
From the above photo, we will observe that the Elliot waves is made up of 5 waves with wave 1-3-5 moving towards the trend direction with 2 and 4 serving as pullbacks/retracements.
In other, for a market trend to be considered as Elliot waves, certain factors are to be met and they include;
Wave 2 shouldn't fall below wave 1
wave 3 should at least be longer than either wave 1 or wave 5 or both.
Wave 4 shouldn't also pull back to the point of wave number 2.
Screenshot
The Correction waves which occur after the complete formation of wave 5 occur due to the inability of the price to continue in the current trend. This inability is due to the exhaustion of buyers or sellers as the case may be.
These correction waves serve as a trend reversal signal which aids buyers to exit the market by taking a profit. After the formation of , correction waves, sometimes comes the beginning of a new Impulse wave formation.
QUESTION 5
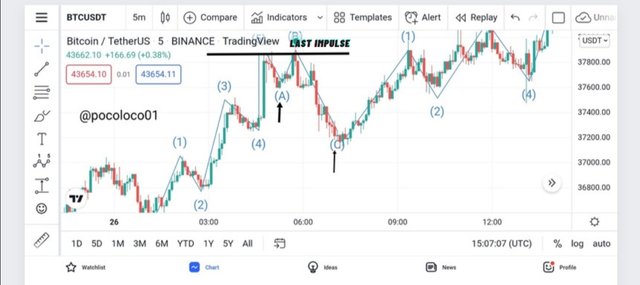
Having looked at how to identify trends using Elliot waves pattern which comprises of Impulse and correction waves, we will now look at how to identify the first and last impulse waves in a trend.
Impulse waves are usually formed after the formation of correction waves which are formed after the complete formation of wave 5 of the Impulse waves.
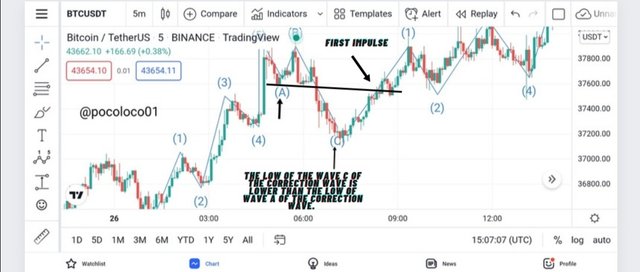
The correction waves serve as a trend reversal signal and during this correction wave formation, a trader who is active on the market will have to wait for the formation of the first impulse in other to enter the market. This first impulse wave often serves as the beginning of a new trend movement either bearish or bullish.
After observing the current trend and making sure that it has a complete formation of waves 1 to 5, then we will observe the correction waves formed. If the previous trend is a bearish one, then the wave C of the correction wave is expected to have a high higher than the high of wave A but if the previous trend is a bullish one, then the wave C of the correction wave is expected to have a low lower than wave A of the correction wave.
Once we clearly observe the above, then there is a high probability of the emergence of a new trend with the first being the first Impulse.
- Importance
This first impulse is important as it aids traders in identifying trends early thereby giving them the opportunity to buy or sell at a lower price in other to exit with good profit by the time the trend has reached to form another correction wave.
- screenshot
- Identification of the last Impulse
In other to properly identify the last impulse, we have to go back to the Eliot waves and carefully count the waves from 1 to 5 in the direction of the trend.
Once we count to the 5th wave which is the last one for a correct Elliot wave, we then observe the correction waves A-B-C. At this point, it is expected of a trader to close any open trade in other to secure profit and possibly reenter the trade after the possible new trend direction has been confirmed.
- Importance
Identification of the last impulse signals traders to exit the market in other to secure profits because what follows afterward is the formation of the correction waves after which is the formation of a new trend that might be either bearish or bullish.
- Screenshot
QUESTION 6
We have already talked about how to identify trends and trend reversals using the Eliot pattern. Now we will be talking about how to identify good entry points to set a buy and sell order.
- BUY ORDER
After we must have carefully identified the previous 5 impulses and correct observation of the A, B, and C correction waves which will lead to a clear identification of the first impulse.
From the below screenshot, we will see that the previous trend is a bullish one and the correction waves have been successfully identified.
Now we will wait for the price to break the previous support at correction wave A that now serve as resistance after it was broken to form wave C.
Once the price breaks and closes above the resistance, we enter the market. Secondly, if the entry was missed, we can wait for the price to pull back once it reaches the other resistance at wave 5 and retests the just broken resistance which now serves as support before we make a buy entry.
- Screenshot
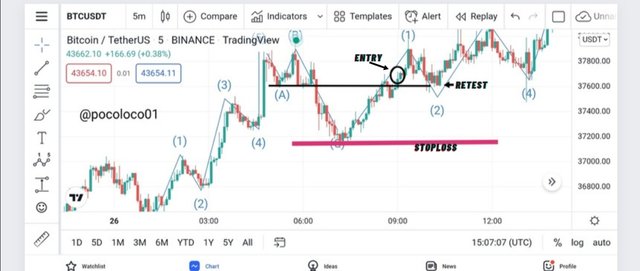
Our stop-loss is to be set just below the low at point C with the take-profit set in consideration of the stop-loss in a ratio of 1:1.
- SELL ORDER
Here we identify the Eliot waves as usual then we observe the formation of A, B and C correction waves. Then we take a sell position just after the price breaks and close below the resistance at wave A.
- Screenshot
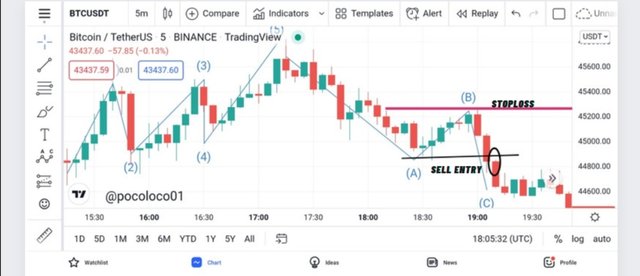
The stop-loss is set just above the wave B and the take profit set in consideration of the stop-loss in a ratio of 1:1.
QUESTION 7
We have previously discussed about how strong hands manipulate the market and prey on weak hands by toying with their emotions and liquidating their positions.
We have also talked about how to identify trends using the Elliot wave pattern. Now, we will be adding another important concept of the Elliot wave theory which is the identification of accumulation and distribution phases.
The relationship between the Elliot wave theory and the manipulation of the market by whales can be seen on the two end waves of the Elliot wave pattern.
- Screenshot
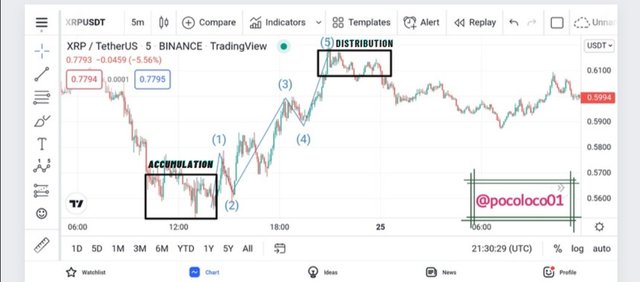
From the above, we will observe that the distribution phase occurs before the break out which leads to the emergence of the Elliott Wave pattern.
This pattern helps retail traders to best understand the activities of Whales. After the accumulation phase, the price breaks out and retail traders seeing that price has gone up tends to jump in with the hope of a continuous uptrend thus helping to push the price up even further for the whales and not log after that the price gets to the distribution phase which is the point at which the strong hands starts to close their positions thereby causing the price to reverse.
This distribution phase is what is regarded as the correction wave in Elliot waves theory. Therefore with a good understanding of this theory, a retail trader can easily spot the activities of the whales and avoid being preyed on.
CONCLUSION
Trading as we have already discussed is simply an act of buying and selling an asset with the aim of making profits.
This act has been so far made easy due to technological advancements that have made it possible for trades to be executed with just a click on a trader's trading device.
The cryptocurrency market is quite volatile and trading it is risky which is why it demands some good knowledge of technical, fundamental, and sentimental analysis in other maximize profits and minimize loss.
As we have understood from the above lecture, the strong hands who are deep pocket investors tend to manipulate the market and prey on retail investors, and we have understood, the best way to avoid this manipulation is to think like a pro.
In other to be able to play the game like a pro, a good understanding of the Elliot waves theory is important as the strategy will help a trader to know when to enter and exit the market in other to avoid being liquidated by the strong hands.
@pocoloco01 - you only currently qualify for #club5050 not #club75
Buenas tardes amigo @steemcurator02, para entrar al club75 o club100 se debe hacer un encendido grande?
Me gustaría verificada mi estado y mi blog.