Crypto Trading with Moving Average - Crypto Academy |S6W2| - Homework Post for Professor @shemul21

Hey guys,
Welcome to the first week of the season 6 SteemitCryptoAcademy lecture by Professor @shemul15.
Without wasting much of our time, let me quickly proceed with the given tasks.

QUESTION 1
Understanding trends and trend direction is one of the most important things to identify for a trader who is out to minimize losses and maximize profits.
Identification of trend directions is vital because it aids a trader in avoiding trading against market trends which is referred to as counter-trading.
Counter-trading is risky because market trends depict who is in control of the market either buyers or sellers and opening a sell position in a market that is currently controlled by buyers can result in massive losses.
In other to avoid the above problem, identification of trends is necessary. Identification trend is important as it aids traders in opening friendly positions just as the popular trading saying says "The trend is your friend".
In other to identify trends, a lot of methods have been put in place and one of the commonest being the interpretation of market harmony which includes the identification of higher highs and lower lows with the former indicating an uptrend while the latter indicates a downtrend.
Identification of higher highs and lows is a good way of identifying trends but it is not efficient as it can give out false signals just as we always see in cases of divergence where the price formation signals a movement opposite to what an indicator is indicating and this always causes a trend reversal.
Interpretation of price movement and formation is good but in other to make trend identification easier and less confusing, the application of trend-based indicators is necessary and that's what will bring us to look at moving average indicators.
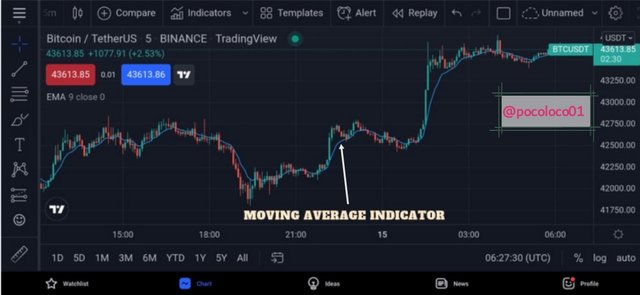
Moving average indicator is a trend-based indicator that helps to filter out minor fluctuations on the price chart thereby making apparent the actual and overall price direction.
The moving average indicator identifies price direction by trending either below or above the price chart. When it is below the price chart, it shows that the current price trend is a bullish one and when it trends above the price chart, it indicates that the current price chart is a bearish one.
The moving average indicator also helps in calculating the average price of marked-out current candles and in addition, it helps in the identification of breakouts and trend reversals and is also good in giving out trading signals.
- Screenshot
QUESTION 2
Having looked at what a moving average indicator is, we will be explaining its various types along side their differences.
The different types of Moving Average Indicators include;
- Moving averagely weighted.
- Simple moving average.
- Exponential moving average.
The Moving Average Weighted is a type of moving average indicator which focuses more on the most recent price by applying more weight to it. Unlike the SMA that adds equal weight on all prices, the MAW takes very little consideration of old prices thereby focusing more attention on recent ones. This makes it useful for scalpers who take advantage of its fast reaction to recent price changes.
- Formula
WMA = (Price1 × n + Price2 × (n-1) +...nPrice) / [ n × (n+1)/2]
Where "n" represents a number of days.
The Simple Moving Average is the commonest type of moving average indicator. It is a type of moving average that is used in calculating the average price of an asset of a given period. Unlike the Moving Average Weighted that concentrates more on recent prices, the Simple Moving Average adds equal weight to all prices over a given period.
- Formular
SMA = (A1 + A2 +...+An) / n
Where "n" represents number of days.
The Exponential Moving Average is a type of moving average indicator that was developed to enhance the efficiency of the Simple Moving Average especially on its effect on recent prices. The EMA focuses more on the recent price by adding more weight to it though not as much weight as the one we see when using the MAW.
This weight added on the recent price by the EMA makes it efficient for short-term traders who are out to identify quick signals in other to enter the market on time and thus reduce the size of their stop-loss.
- Formula
EMAr = [ Rp × (s/1+n)] + EMAp × [1 - (s/1 + n)]
Where EMAc = Recent EMA
Rp = Recent price
EMAp = Previous EMA
S = Soothing factor
n = njmber of days.
| EMA | SMA | MAW |
|---|---|---|
| EMA makes use of smoothing and recent prices during calculation. | The average of the mean of price over a given period is used in the calculations | The most recent price is first used during its calculations. |
| The EMA is more efficient for short term traders | SMA is more efficient for long term traders. | MAW is more efficient for scalpers. |
| SMA is more of a lagging indicator when compared to EMA due to its delay in identifying recent price changes. | EMA reacts fast to price changes thereby aiding short-term traders in reducing the size of their stop-losses. | MAW is very much sensitive to the most recent price because it pays little concentration to old prices and focuses more on recent ones. |
| The SMA with higher values adds are more important and this is for the fact that SMA is used in calculating the average of price over a given period and it thus adds equal weight to all prices. | Lower value EMA is more valuable because the EMA provides signals by focusing more on recent prices. | MAW of lower of either high or low value is very much ok because the indicator is developed in a way that it focuses on recent prices thereby higher or lower value won't keep it from focusing on recent prices for quick signals. |
- screenshot
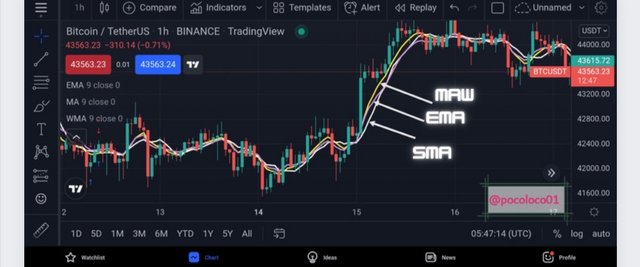
From the screenshot above, we will see the three moving average indicators applied on the BTC|USDT price chart. Observing closely, we will see that the white indicator which is the SMA is more away from the price while the EMA is closer but not as close as the MAW which is the closest to the price chart.
QUESTION 3
We have looked at the different types of Moving averages and what differentiates them. Here will we be looking at how to identify entry and exit points using the moving average indicator.
In performing this task, I will be combining an EMA and an SMA. This is because an SMA adds more weight to all prices therefore it will be very much efficient in identifying the overall price direction. On the other hand, THE EMA will also be used due to its concentration on recent prices therefore it will be efficient in identifying buying and selling opportunities faster than the SMA.
- ENTRY POINTS
I will be using an SMA of (50 periods) and an EMA of (20 periods) in performing this task on a BTC|USDT pair - 1hr
In other to identify a good entry using the two moving average indicators, I will first observe the position of the SMA because it is more efficient in identifying the average price of an asset thereby making more clear its trend over time.
If the SMA is above the price chart, then it is a bearish movement and if it is below the price chart, then it is a bullish trend. After identification of the price chart using the SMA, I will look to observe the EMA by focusing on its action as regards the most recent price.
Once the price breaks above or below the EMA, it is a signal for a trend reversal. Also, the EMA tends to serve as a support or resistance for a trending price and with that in mind, a trader can also wait for a retest of price on the EMA before opening a position.
- Screenshot
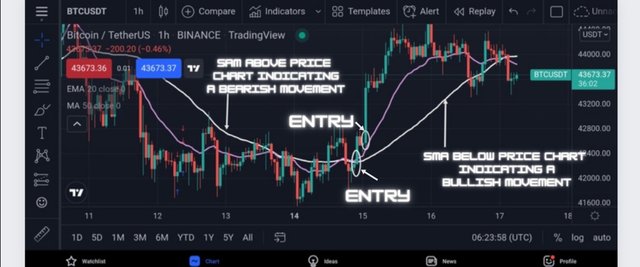
From the above screenshot, we will see that the price of the initial trend was a bearish one as identified by the SMA and after some time, the price moved over the EMA which signaled a bearish-to-bullish trend reversal.
At this point, a short-term trader can take a buy position or rather wait to see the price retest on the EMA which now serves as a support in other to be more certain that the trend has reversed before taking a buy position just as seen above.
- EXIT POINTS
Aside from manually exiting trades without any proper trade management in place, there are just two known methods of existing trades automatically and they include the use of Stop-loss and Take-profits.
Using a stop-loss is vital as it helps to minimize loss should in case the trade goes against the trader's speculations. And the same time, setting an automatic target is essential as it helps a trader to close in profit in other to avoid price reversing and thus turn possible profit into a loss.
From the above analysis using SMA and EMA, the stop-loss is to be set just below the SMA because if the price breaks below it, that will serve as a signal for trend reversal.
The Target should be set in a ratio of 1:1,1:2 or 1:3 in consideration of the Stop-loss.
- Screenshot
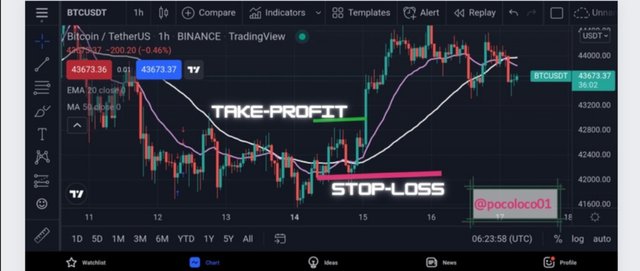
The target is set in a ratio of 1:3 in consideration of the stop-loss.
QUESTION 4
We have explained some plain methods of taking an entry using the moving average indicators. Here we will further look at another method of signal generation while using the moving average indicator and this technique is regarded as the Crossover.
The Crossover Technique is a technique that signals traders on possible trend reversals. It involves the application of two moving average indicators with one being slow and the other fast.
With that in mind, we can easily utilize this strategy by applying an SMA and an EMA on a price chart with the EMA serving as the fast-moving average because it reacts faster to price changes while the SMA serves as the slower moving average due to its delay in providing a signal.
When the EMA crosses above the SMA, it signals a bearish-to-bullish trend reversal and therefore a trader is expected to wait for more confirmations such as price breaking above the moving average indicator before taking a buy position.
Also, when the fast-moving average indicator crosses below the SMA, it indicates a bullish-to-bearish trend reversal, and a trader is also expected to wait for further confirmation such as price breaking below the moving average indicator before taking a sell position.
- Screenshot
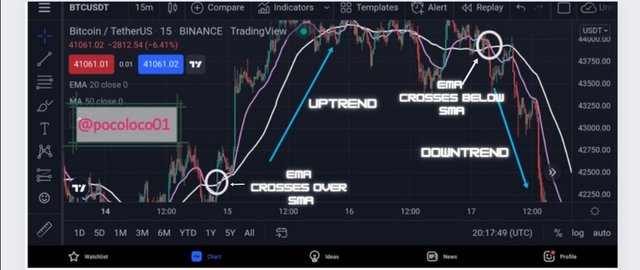
From the above screenshot, we will see that as the EMA crosses over the SMA, it signals a bearish-to-bullish trend reversal which was further confirmed by the breaking of the moving averages by the price. As soon as this is spotted, a buyer is expected to take a buy position.
Also, on the same chart, we can see the EMA crossing below the SMA indicating a bullish-to-bearish trend reversal which was further confirmed by the breaking of the moving average by the price. Once the trend reversal signal is given by the crossing of the EMA above or below the SMA, and it is further confirmed by the price breaking the moving average indicator, a trader is expected to take either a buy or sell position as the case may be.
QUESTION 5
We have already explained the various types of moving averages, their differences and we have also identified how to make an entry and exit using the moving average indicator and also how to spot various signals using the indicator.
All that have been mentioned and explained above, it looks as though the moving average indicator is perfect but that's not an absolute truth as there are some limitations regarding the indicator and that is what we will be looking at in this section.
The moving average indicator is a lagging indicator which makes it slow in signals identification thereby limiting traders in entering the market fast enough in other to secure maximum profit. Being a lagging indicator, it doesn't always allow traders to reduce the size of their stop-loss due to its delay in giving out signals.
The moving average indicator also does not provide traders with maximum information required in other to carry out an efficient trade. Its information is limited to the calculation of the average price of an asset over time which in turn makes it possible for it to identify price direction. Information such as the level of market volatility, momentum, etc, are not provided by the moving average indicator.
The moving average is best used on trending markets and if used when the market is ranging, it provides no useful information.
Using the moving average indicator is not as simple as just inputting it on a chart, a good knowledge of its settings is required especially its periods because using a particular period on an unsuitable timeframe can easily lead to false signal generation.
CONCLUSION
The moving average indicator is a trend-based indicator that other than the identification of trend direction serves a whole lot of other purposes such as identification of breakouts, trend reversals, continuation, etc.
Traders based a lot of technical analysis using the various types of moving average indicators due to their efficiency in providing signals. But In as much as the moving average indicator is good, it is best used in combination with other technical analysis tools and price action techniques for more efficient signals identification and confirmation which will in turn help to minimize loss and maximize profit.
@tipu curate
--
This is a manual curation from the @tipU Curation Project.
Upvoted 👌 (Mana: 0/6) Get profit votes with @tipU :)
Bittorrent Golden Wallet Prizes
For steemit users prizes are distrubuted based on their profile reputation Point. Don't get behind Sign in Now CLICK HERE and claim your BTT now
Reputation Point based Prizes: