Leverage With Derivatives Trading Using 5 Min Chart ]-Steemit Crypto Academy | S6W1 | Homework Post for @reddileep
Hey guys,
Welcome to the first week of the season 6 SteemitCryptoAcademy lecture by Professor @reddileep
Without wasting much of our time, let me quickly proceed with the given tasks.

QUESTION 1
Before we talk about leverage trading, let's simply look at what trading is all about.
Trading is simply an act of buying and selling assets or commodities with the sole aim of making profits.
.jpeg)
When we talk about trading in cryptocurrency, we are simply referring to an act of taking advantage of market movement in purchasing a crypto asset at a low price or selling a crypto asset for a profit.
Those who engage in the act of buying and selling of these crypto-assets are regarded as crypto traders and they do so using various trading platforms which offer different trading options.
These trading options include Spot Trading and Leverage Trading.
Spot trading is a type of cryptocurrency trading that occurs immediately (on the spot).
Trading cryptocurrencies using a spot account does not necessarily need advanced knowledge of cryptocurrency trading as there is no need of performing an advanced chart analysis or complex calculations.
Also, spot trading does not recognize shorting as all it requires is absolute patience from the trader in other for the purchased crypto assets to gain more value which normally takes time to happen.
Most traders engage in spot trading due to its minimal risk as there is no such thing as liquidation as loss comes as a result of a general decrease in asset price while profit is made when there is an increase in asset price and this increase and decrease of the asset price in spot trading follows the actual price movement of that particular crypto asset in real-time unlike what we see in leverage trading.
Leverage Trading which is sometimes regarded as Margin Trading is simply any form of trading that allows a trader the ability to borrow funds in other to increase their trading position beyond what would have been available when considering their actual balance.
Traders who engage in leverage trading usually take advantage of a market uptrend and downtrends in taking either long or short positions which thereby gives them fast profit if the trade goes as predicted. At the same time, a huge loss is made if the trade goes against their speculations.
Leverage Trading can also be regarded as one of the most profitable and at the same time the riskiest form of trading due to its facility that allows traders to trade using up to 20x of their actual capital.
Therefore, this type of trading requires advanced knowledge in technical analysis and other trading strategies in other to properly identify market behavior which in turn will aid in accurate prediction of market movement.
QUESTION 2
Leverage Trading is beneficial due to several factors which include;
LEVERAGE
One of the main importance of Leverage Trading is the fact that it allows users the ability to borrow funds. This feature is quite beneficial especially to low capital traders who would want to open large positions beyond what their actual capital could afford.
HIGH PROFIT
Profit-making is very much high in leverage trading due to the fact that it allows traders the benefit of opening positions using up to 20× of their actual capital. This means that the actual profit which would have been made using the actual capital will be multiplied by 20.
INCULCATES DISCIPLINE
Leverage Trading teaches discipline because a trader who is trading using leverage knows quite well that he or she can lose all funds at any slightest mistake or lack of discipline. Therefore a leveraged trader tends to be very careful in decision making knowing fully well that any wrong decision can easily lead to liquidation.
QUICK PROFIT
Leverage Trading also allows traders the opportunity of making quick profits within a short time by merely taking advantage of current market trends.
DIVERSIFICATION
Leverage Trading allows users to easily diversify their trading positions due to the availability of Leverage. This means that traders can open different trading positions using as low as $20 actual capital on each position and still make a reasonable amount of profit with the addition of borrowed funds.
QUESTION 3
In as much as Leverage Trading has a lot of benefits, there are still some series of disadvantages associated with it and they include;
COMPLEXITY
Leverage Trading demands a high level of knowledge in trading especially in the areas of technical analysis, fundamental analysis, and risk management. A trader who is lacking in these areas has a very high chance of getting liquidated.
HIGH RISK
I'm as much as Leverage Trading is very profitable, it is also very risky due to the fact that trades are usually opened using multiple times the actual amount of capital the trader actually has. This makes risk and rewards high as they are calculated in consideration of the leverage.
HIGH CHARGES
Leverage Trading comes with higher trading fees when compared to spot trading and also leaving a trade open overnight attracts additional charges which is very different from spot trading which charges nothing when it comes to holding trades.
RISK OF SCAMS
Leverage Trading can only be done on centralized exchanges unlike spot trading that can also be done in decentralized wallets. This leaves the assets of Leverage traders open to possible scams.
RESTRICTIONS
The fact that Leverage Trading is mostly done on centralized platforms, makes access limited at certain points due to either maintenance, upgrade, or failed verification.
QUESTION 4
Just as previously stated, Leverage Trading demands a good knowledge of technical analysis alongside other trading strategies such as risk management and fundamental analysis.
In other, for a trader to efficiently perform technical analysis, a good knowledge of indicators, their application, and their uses are paramount.
In leverage trading, a lot of indicators are essential in determining the market direction and possible movements and they include; EMA, PARABOLIC SAR, SuperTrend, MACD, RSI, etc.
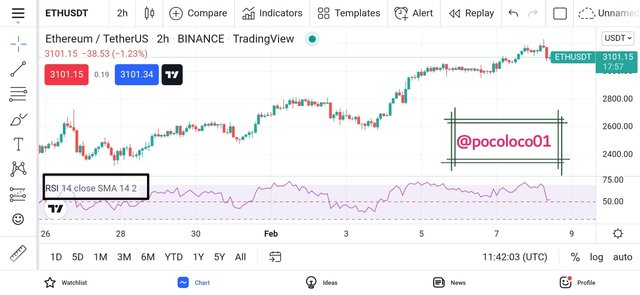
RELATIVE STRENGTH INDEX
RSI is a volatility-based indicator that signals a trader when an asset is either being oversold or overbought.
When the indicator moves above the 70 mark, it indicates an oversold region thereby making a trader aware of a possible reversal. Also, when it moves below the 30 mark, it indicates an oversold region thereby signaling a trader of a possible price reversal.
With the confirmation of signals given by other indicators, a trader can easily take either a buy or sell position as the case may be.
- Settings
Setting the RSI Indicator requires a few adjustments such as removing some of its parameters which are not necessary and these unnecessary parameters include;
The RSI upper band, Lower Bollinger Band, Upper Bollinger Band, RSI-Based MA.
In addition, the band ground color of the middle band and the RSI can be modified in consideration of the background color in other for it to be readily visible.
- Screenshot
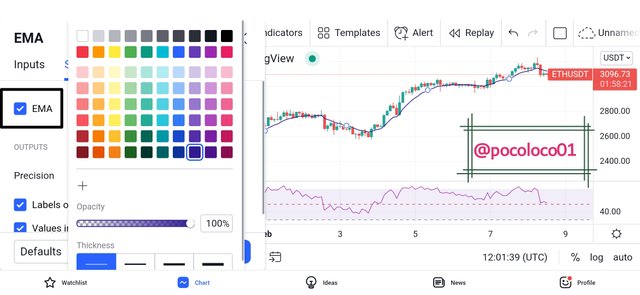
EXPONENTIAL MOVING AVERAGE
The EMA is a trend-based indicator that aids in identifying market trends. It does this by filtering out minor fluctuations and making obvious the actual trend direction of the market. It's the difference with the Simple Moving Average (SMA) lies in the fact that it focuses more on recent prices by applying more weight to it.
When the EMA, trends above the price chart, it shows that the market is down trending and when it trends below the price chart, it shows an uptrend movement.
- Settings
Not much is changed on the default settings of the EMA. The period can be set to be at 100 or 200 and the background color set in consideration of the chart color in other for it to be readily visible.
- Screenshot
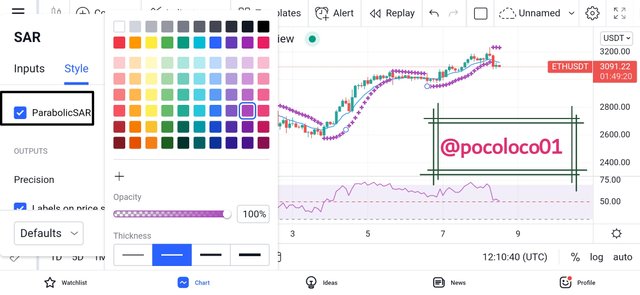
PARABOLIC SAR
Similar to the EMA, the Parabolic SAR indicator Is a trend based which identifies trend direction by trending either above or below the price chart.
When it trends above the price chart, it indicates a downtrend and when it trends below the price chart, it indicates an uptrend.
- settings
The default settings of the Parabolic SAR need not be changed but just a simple modification in color and thickness is necessary.
- Screenshot
QUESTION 5
I will be performing this particular task on a reduced time frame preferably 5 mins. And I will also be switching from the normal candlestick charts to Heikin Ashi Charts. This is in other to have a more smooth chart on which the analysis will be carried out.
- Screenshot
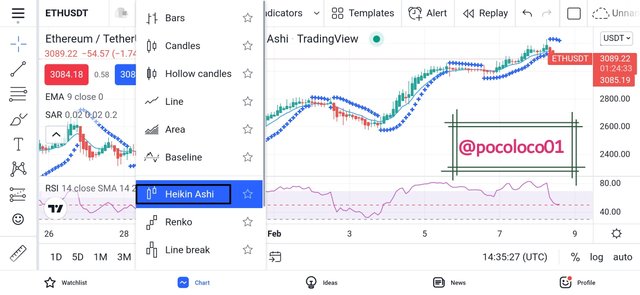
After we must have applied all the relevant indicators as seen above, we will look to identify confluence amongst them before taking a position.
- ANALYSIS
I will first observe the position of the EMA in other to identify the actual trend of the market. If the EMA is lying below the price chart, it is an indication of a bullish trend and a bullish position is only required.
After identifying the position of the EMA, I will observe the position of the Parabolic Sar and if it is currently forming below the price chart, it is a signal of an uptrend.
In other to increase the confirmation of the signal provided by the EMA and Parabolic Sar, I will move to check the position of the RSI and if it is below the midpoint, then it is an indication of a possible uptrend.
The accuracy of the signal provided by the RSI tends to be higher if the indicator is close or already at the oversold region (below the 30-mark).
- screenshot
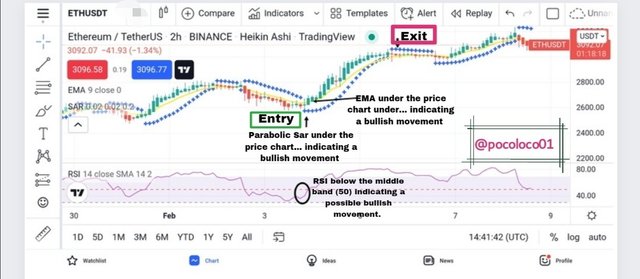
- ENTRY AND EXIT POINTS
We take our position once all the above signals are in confluence.
For a buy position, we will check to see if the EMA is below the price. After that, we lookout for the Parabolic Sar to know if it is formed below the price chart which will serve to confirm the initial signal given by the EMA.
When the above must have been confirmed, we move further to identify the position of the RSI and if it is below the mid-point, it is an indication of a bullish movement and a buy position is advised.
On the Exit part, we keep watch on the price trend and once we observe the forming of the Parabolic Sar above the price chart and the RSI above the mid-point, it is an indication of a possible price reversal therefore we are expected to take profit at this point.
QUESTION 6
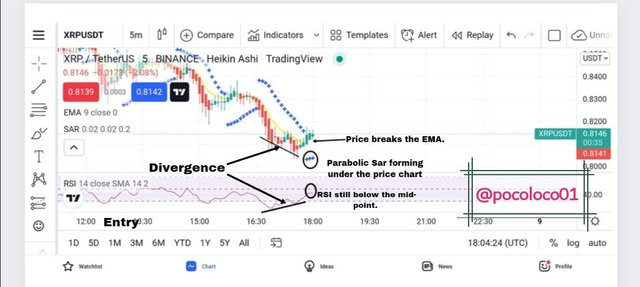
I will be performing this task analysis on a 5min chart of XRP|USDT using the TradingView platform.
I started by applying the necessary indicators which include; RSI, EMA, and Parabolic Sar on a 5min chart of XRP|USDT.
After the application of the above-mentioned indicators, I observed the position of the most recent Parabolic Sar and saw that it formed below the price chart. I went further to check the position of the RSI which I saw to be below the midpoint.
The above two indicators were signaling the same thing which is a possible bullish movement.
In addition, I looked at the chart carefully and spotted a divergence which is an indication that the current downtrend is already weak and it's prone to a possible reversal.
The above observations convinced me that the price will move up so I waited for it to break the EMA before taking a buy position.
- Screenshot
- ENTRY AND EXIT
- Entry
After careful observation of the above indicators which signaled a bullish movement, I waited for the price to close above the EMA before making my entry.
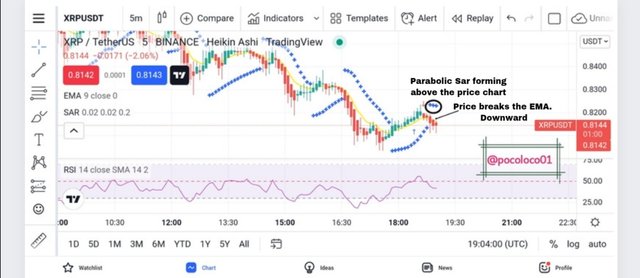
- Exit
I carefully observed the price as it keeps moving up until I spotted the appearance of three Parabolic Sar dots which is a signal of a possible reversal.
In addition, the price moved below the moving average indicating a bearish movement. After I saw the two indicators signaling the same thing (Confluence), I exited the market thereby closing on a minor profit.
- Screenshot
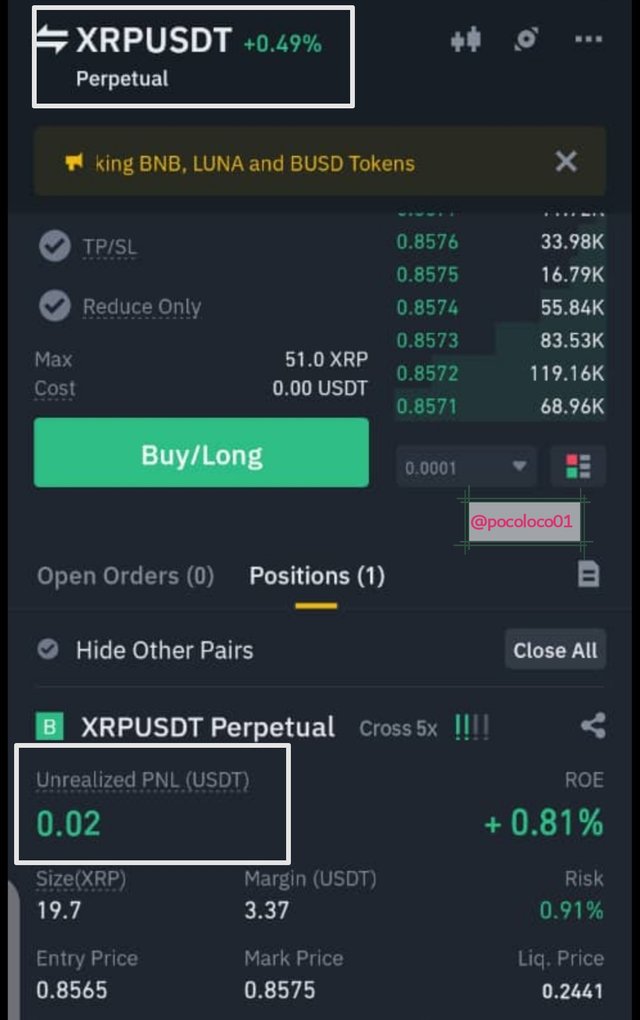
- TRADE RESULT
CONCLUSION
Leverage trading is any form of trading which allows a traders the privilege to borrow funds in other to open positions larger than what their actual trading balance could have covered.
This allows high profit-making for low capital traders. At the same time, leverage trading is very risky as a trader has a very high risk of losing all capital if the loss goes beyond what the actual capital can cover.
Therefore, leverage trading requires a very good knowledge of technical analysis, fundamental analysis, and risk management in other for a trader to maximize profits and minimize losses.