Starting Crypto Trading - Steemit Crypto Academy |S6W1 - Homework Post for Professor @pelon53

Hey guys,
Welcome to the first week of the season 6 SteemitCryptoAcademy lecture by Professor @pelon53
Without wasting much of our time, let me quickly proceed with the given tasks.

QUESTION 1
Trading and investing in the financial market is risky due to its price uncertainty. This has led traders and investors into carrying out various research and analysis before making a financial decision to reduce the risk of making an unfavorable one.
This fear of making a wrong decision is what has led to the emergence of different types of analysis which include; Fundamental analysis, sentimental analysis, and technical analysis.
In this section, we will be focusing on the fundamental analysis.
Fundamental analysis is an old method of financial analysis that can be traced back to Benjamin Graham in the year 1928. This type of analysis which is also regarded as macroeconomic analysis is the weighing of financial data drawn from a given project in other to determine its prospects and possibility of thriving.
This type of analysis focuses on information such as assets supply, size of the community, active addresses and transfers, on-chain matrices, news and information regarding an asset or a project, and other financial activities.
All the above-listed information and much more help a trader in determining if an asset is undervalued or overvalued and its the possibility of thriving and beating out its competitors.
Areas of concentration of fundamental analysis tend to be different for traders and investors as what affects the former may not affect the latter.
Let's take, for example, fundamental analysis was carried out on a crypto asset and it was discovered that it has a lot of interesting use cases but it's the amount of supply is way too much. We already know that when the amount of supply of an asset is too much, it tends to reduce scarcity which in turn decreases the price. This fundamental knowledge will tend to discourage investors but at the same time, it has little or nothing to do with traders.
Also, long and short-term investors tend to focus on different areas as the former focuses more on the use cases while the latter is only interested in updates and information that tends to generate quick profits.
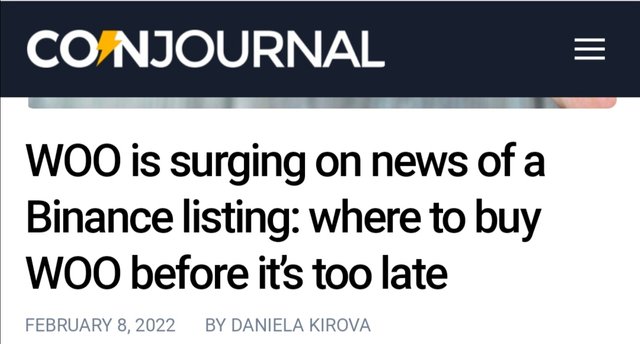
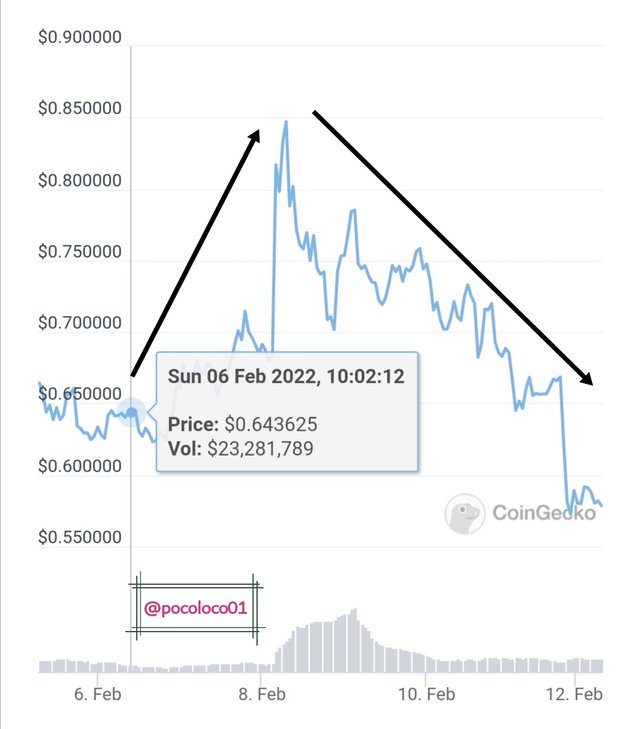
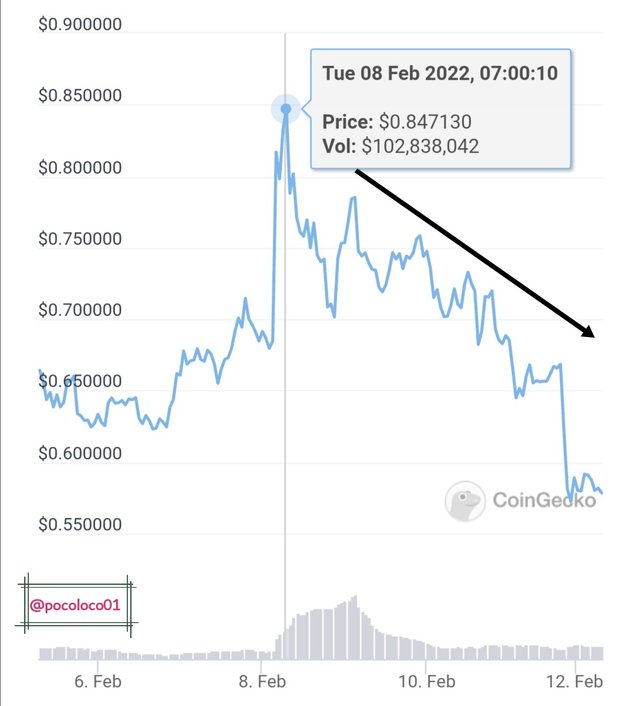
The above information tends to be good for short term investors who will only buy way before Binance listing and sell off a few hours before listing or immediately it's listed while a long term investor will ignore the information and might buy ways after it has been listed on Binance and that is if the project is a good one.
- See screenshots
- Screenshot
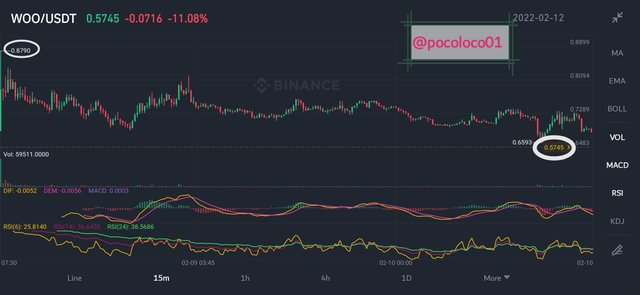
From the above information, we will see that the price of Woo network rose after the Binance announcement and fell after the Binance listing which is a good investment for short-term investors and a bad one for long-term investors.
Understanding fundamental analysis is very important for a trader as it helps to avoid making bad investment decisions. Good knowledge of it also helps an investor to know the right time to enter an investment and the right time to exit it just as what we have seen in the above example using Woo network.
QUESTION 2
We have previously talked about fundamental analysis and its importance. In this section, we will be looking into Technical analysis.
Technical analysis is the oldest form of financial market analysis which was introduced by Charles Dow in the late 1800s. This form of analysis was first regarded as hooks until the late 1970s and currently, it is the major type of analysis that dominates the world financial market.
Technical analysis is primarily based on the fact that history always tends to repeat itself. Therefore previous behaviors on the market which are represented on the price charts are recorded and future behaviors tend to be predicted using those old data.
Simply put, Technical analysis is a type of market analysis that deals with the prediction of possible price movement of assets by considering previous market information such as price, volume, and other market data.
Analysis using the technical methods is based on two techniques which are The use of indicators and Price action.
- Price action technique
Price action technique deals with the study of the price chart, its movement, and formation in other to carefully analyze the possible movement of an asset.
This type of technical analysis is best performed on a candlestick chart due to its mode of formation that allows many details to be seen on the price chart. Some of these details include; trends, buying pressure, price open and close, price high and low, volume, and several other activities of buyers and sellers.
The very fact that this method of technical analysis is solely dependent on the price chart with no external application of indicators makes it the basics of technical analysis.
In as much as this method of technical analysis can be regarded as the basics of technical analysis, the information provided by it is not always accurate and for that, the use of indicators in combination with this technique is best advised.
- The use of indicators
The use of Indicators in carrying out technical analysis has proven to be efficient over the years because these indicators allow clear observation of market activities such as price direction, level of volatility, price momentum, price volume, breakouts, support, and resistance levels, and a lot more.
In as much as some of the above-listed activities such as trend direction can be identified using merely the price action technique, the use of indicators makes it much easier and clearer.
Identifying trends by taking note of the market harmony such as higher highs and lows can sometimes be misleading due to various price fluctuations but with the application of trend-based indicators such as moving averages, it makes it much easier and less misleading as such indicators indicate market directions by filtering out minor fluctuations thereby making apparent the actual price direction.
In as much as the use of indicators has proven to be efficient over the years, it is still best to be combined with the price action technique in other to create more confluence which in turn increases the level of trading accuracy.
In general, technical analysis tends to help traders in making trading decisions because it allows them to know when to enter and exit the market.
Also, a good knowledge of technical analysis helps to avoid counter-trading as it aids traders in identifying trend direction thereby preventing them from trading against it.
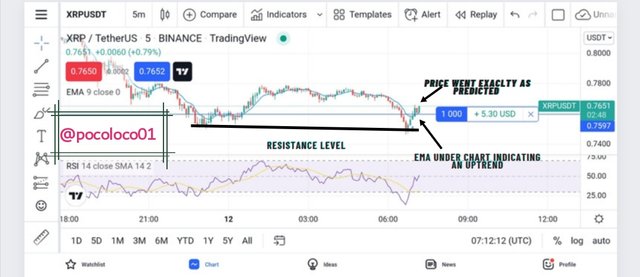
Let me quickly perform technical analysis to throw more light on the above explanation.
- Analysis
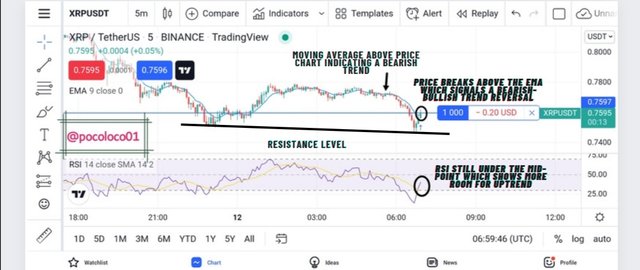
- Result
QUESTION 3
Having talked about fundamental and technical analysis, we will now move to performing a technical analysis on a cryptocurrency market.
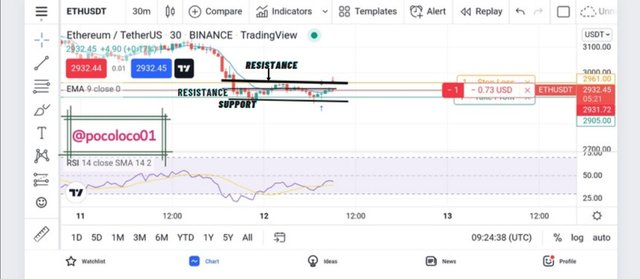
On this analysis, we will be making a sell order by taking note of the support and resistance lines on a 30 minutes and 1-hour time frame.
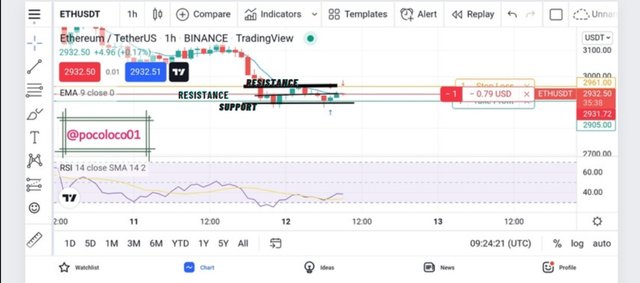
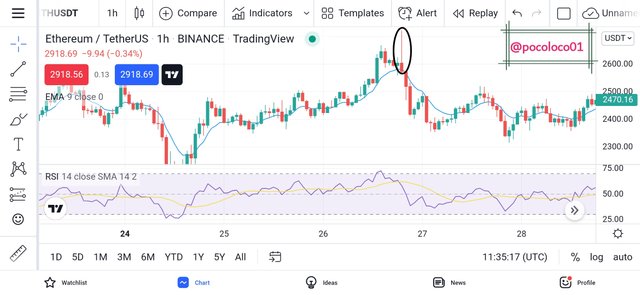
From the above analysis, I saw that the price of ETH is almost at the resistance region located at the $2940 region. Following the market psychology, I believed that the price will reverse to the downside which made me take a sell position with stop-loss set just above the support and take-profit set at the nearest resistance giving a risk to reward ratio of 1:1.
- After analysis
Trade has moved from $-0.79 during entry to a profit of $8.96 with a high chance of being more positive.
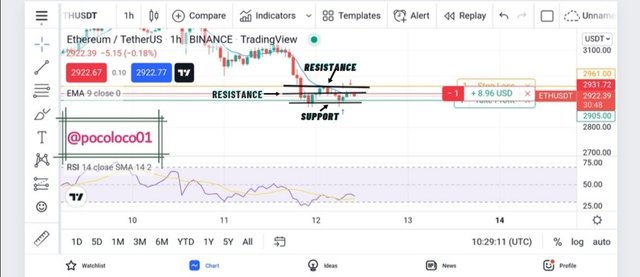
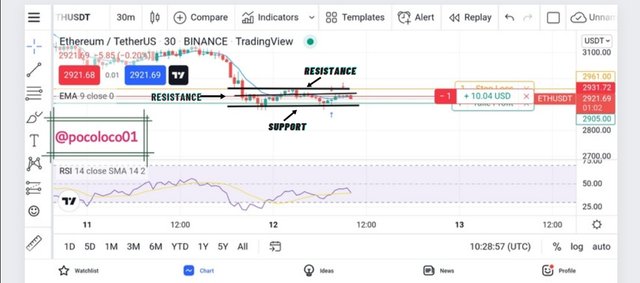
From the above analysis, I saw that the price of ETH is almost at the resistance region located at the $2942 region. As regards market emotions, I believed that the price will reverse on the downside which made me take a sell position with mystop-loss set just above the support and take-profit set at the nearest resistance giving a risk to reward ratio of 1:1.
- After analysis
Trade has moved from $-0.73 during entry to a profit of $10.04 with a high chance of being more positive.
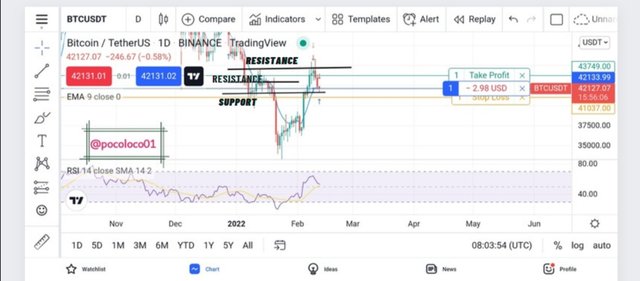
QUESTION 4
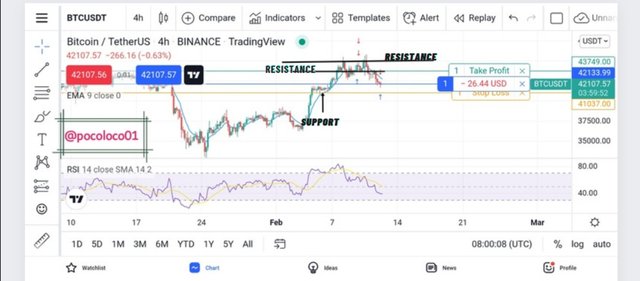
From the above analysis, I saw that the price of BTC is almost at the support region located at $41421 region. Following the market psychology, I believed that the price will reverse to the upside at this zone which made me take a buy position with stop-loss set just below the support and take-profit set at the nearest resistance giving a risk to reward ratio of 1:2.
- After analysis
Trade has moved from $-26 during entry to a profit of $86 with a high chance of being more positive.
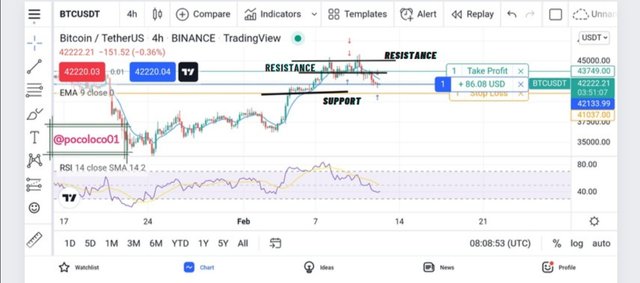
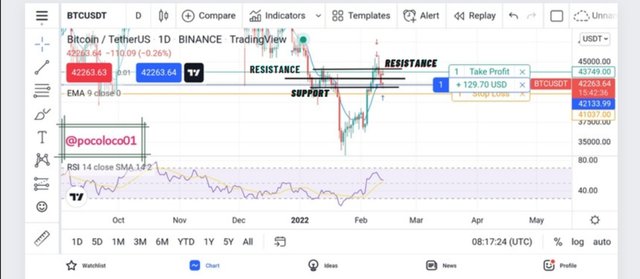
From the above analysis, I saw that the price of BTC is almost at the support region located at $41420 region. Following emotions in the market, I believed that the price will reverse which made me take a buy position with stop-loss set just below the support and take-profit set at the nearest resistance giving a risk to reward ratio of 1:2.
- After analysis
Trade has moved from $-6 during entry to a profit of $129 with a high chance of being more positive.
QUESTION 5
On this section, we will be explaining the Hanging man and Shooting Star candlestick patterns.
- HANGING MAN
The Hanging man Candlestick pattern is regarded as a bearish reversal candle that comprises a short upper body and a long low shadow. This type of candlestick pattern is usually found at the top of an uptrend thereby signaling a bullish-bearish trend reversal.
The pattern of formation of the Hanging man shows a level of struggle for dominance between the buyers and sellers in the market with the buyers trying to keep the price moving up while the seller's effect is bent on pulling the price downwards.
The spotting of the Hanging man isn't an absolute confirmation of a bearish movement as buyers might sometimes win the struggle thereby a trader should wait for further confirmation such as the formation of the bearish engulfing candle before taking a sell position.
- Screenshot
- SHOOTING STAR
The shooting star is a bearish reversal candle pattern that is usually formed at the top of an uptrend. It is made up of a lower body and a long upper shadow.
Similar to the hanging man, the shooting star candlestick pattern is formed as a result of the struggle for dominance between buyers and sellers with buyers initially sending prices high up before being exhausted thereby leaving control in the hands of sellers who in return pulls price backward. Although the price does not go below the open before closing.
In as much as this is a bearish reversal pattern, it is always best for a trader to wait for further bearish confirmation such as the formation of a further bearish candle preferable to the bearish engulfing candle before taking a sell position.
- Screenshot
CONCLUSION
Cryptocurrency is very volatile and for that reason trading and investing in it is quite a risk.
Traders who trade cryptocurrency are expected to have a good knowledge of technical and fundamental analysis which will aid them in making good trading decisions.
In as much as these two analyses mentioned in this lecture are good on their own, it is always best for a trader to combine both in other to maximize profit and minimize loss.
Thank you very much professor @pelon53 for this educative lecture.