Ultimate oscillator indicator- Steemit Crypto Academy- S5W8-Homework post for @utsavsaxena11.
Hey guys,
Welcome to the last week of the season 5 SteemitCryptoAcademy intermediate lecture by Professor @utsavsaxena11.
Without wasting much of our time, let me quickly proceed with the given tasks.

QUESTION 1
Ultimate Oscillator Indicator is an exceptional momentum based indicator which was developed by Larry Williams in 1976.
Similar to other momentum-based indicators, the Ultimate Oscillator Indicator provides signals by identifying overbought and oversold regions on the asset price.
It can identify this using its range values which range from 0 to 100. This value indicates an overbought region when the level is above the 70 mark and an oversold region when the level is below the 30 mark.
The exceptionality of this indicator lies in its ability to make use of multiple timeframes thereby preventing multiple signal generation which in turn helps in the reduction of false signal generation.
This reduction in multiple signals helps to increase trading accuracy because traders will have less chance of entering a wrong trade.
The Ultimate Oscillator Indicator also helps in the identification of divergences which occurs when the indicator is signaling what is contrary to the price chart.
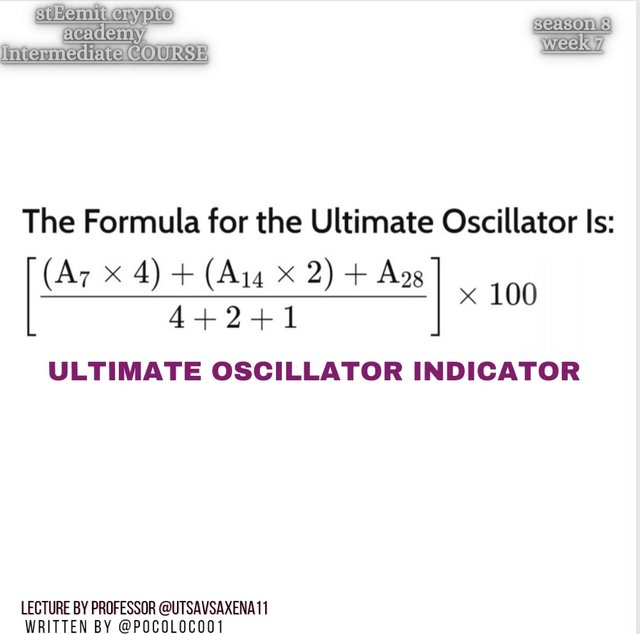
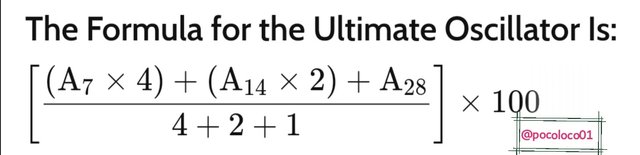
The Ultimate Oscillator Indicator can easily be calculated using the general formula which states;
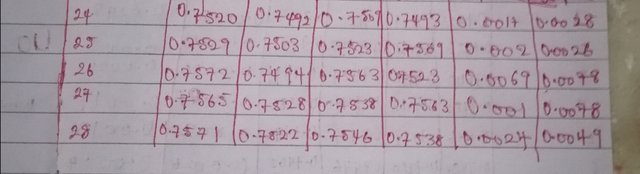
From the above photo, we will observe that;
A7 = Sum of BP for the past 7 days ÷ Sum of TR for the past 7 days.
A14 = Sum of BP for the past 14 days ÷ Sum of TR for the past 14 days.
A28 = Sum of BP for the past 28 days ÷ Sum of TR for the past 28 days.
In using the Ultimate Oscillator Indicator formula, we have to first get the values of the following using a real chart.
A7,
A14
A28
In other to get the values of the above, we will, first of all, get the values of the BUYING PRESSURE (B.P) followed by the values of the TRUE RANGE (T.R) of each candlestick on the price chart...(28) candlesticks.
- Calculating for BUYING PRESSURE (BP)
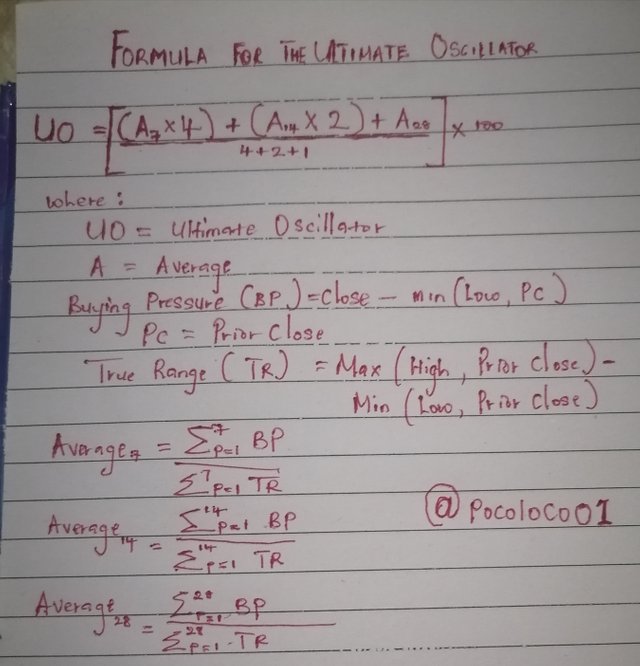
In calculating the Buying pressure (BP) we will be making use of the formula below;
B.P = Close - Min (Low or PC)
Looking at the above formula, we will observe that some parameters are required and these parameters include; OPEN, CLOSE, HIGH, and LOW of each of the last 28 candles on the preferred chart.
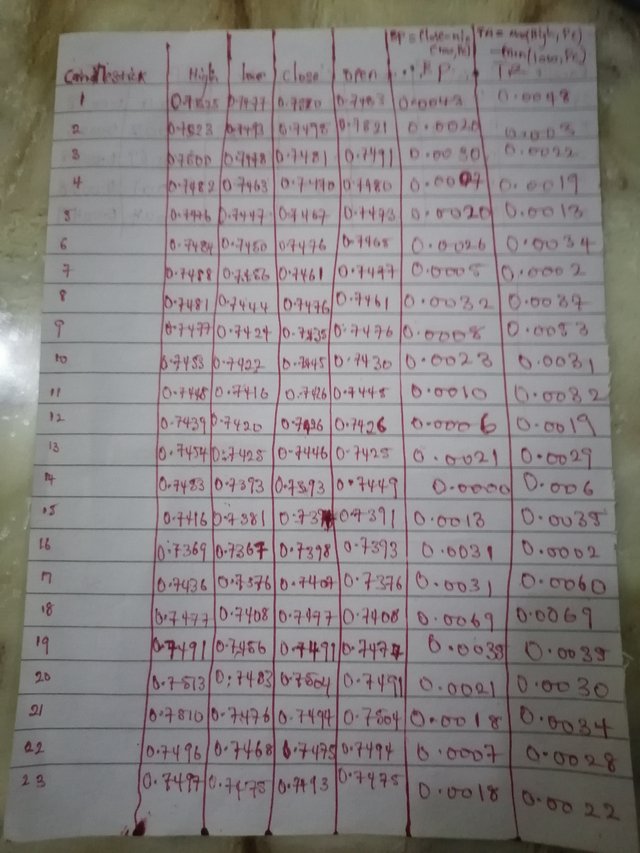
After carefully observing and writing down the parameters of the above candlesticks, we will proceed with the calculation using the formula below;
- B.P = Close - Min (Low or PC)
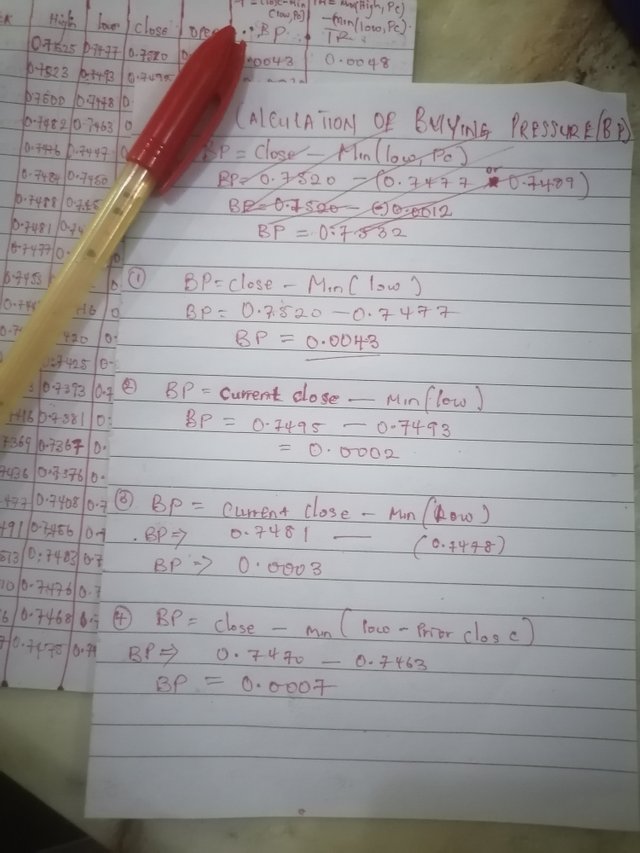
From the above screenshot, we have;
- BP = Close - Min (Low or Prior Close).
This means that in other to get the BP of a candle, we will either subtract the low of the current candle or the prior close of the proceeding candle from the Close of the current candle.
NOTE: If the low has a lesser value than the Prior candle, we will go with the value of the low and vice versa.
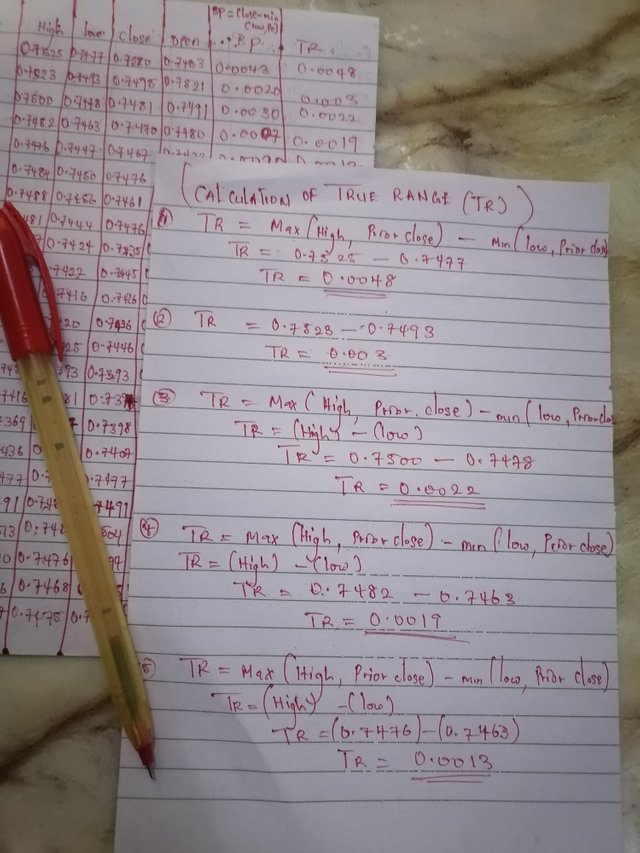
- Calculatimg for TRUE RANGE (TR)
After calculating the BP of the last 28 candles using their already listed parameters, we will proceed with calculating the TRUE RANGE (T.R) of the of each candle using the already listed parameters by applying the formula below;
- TR = Max(High or PC) - Min(Low or PC)
- Calculating for the THREE AVERAGES
After calculating for the True Range just as seen above, we will now proceed with calculating for the three averages which includes;
A7
A14
A28
In calculating the averages, we will be making use of the below formula;
Average = Sum of BP ÷ Sum of TR
- Average7 = 0.015 ÷ 0.0168
Average7 = 0.8988
- Average14 = 0.0251 ÷ 0.0429
Average14 = 0.5851
- Average28 = 0.0634 ÷ 0.1003
Average28 = 0.6321
After getting the values of the three averages, we will now move to the final calculation which is the substitution of the averages on the main equation.
source
UO = [((0.8988 × 4) + (0.5851 × 2) + 0.6321)/7]×100
UO = [(3.5952 + 1.1702 + 0.6321)/7] × 100
UO = [5.3975/7] × 100
UO = 0.7711 × 100
UO = 77.11
QUESTION 2
Trend identification using the Ultimate Indicator is similar to trend identication using other momentum indicators.
In other to identify trends using the Ultimate Oscillator, one should pay attention to its overbought and oversold signal identification.
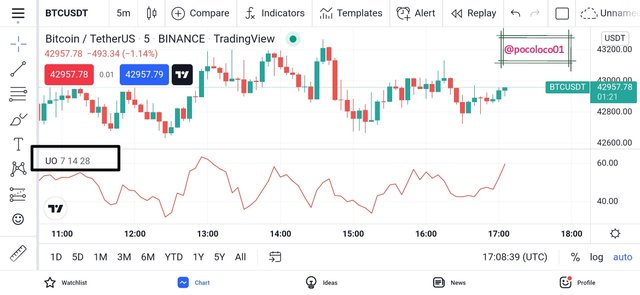
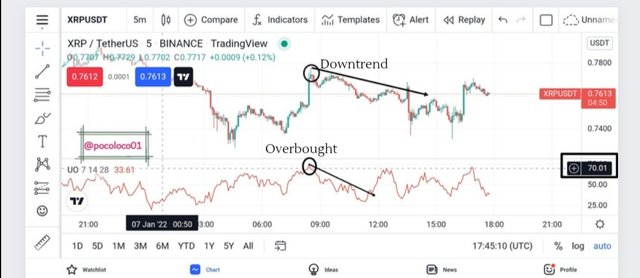
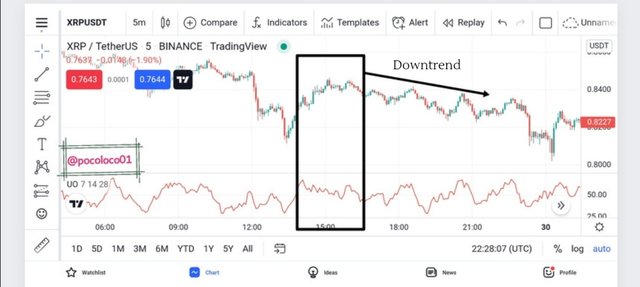
- IDENTIFICATION OF DOWNTRENDS
When the indicator is above the 70 mark, it indicates that the asset is in an overbought region which in turn indicates that the asset will move downwards and continue in a downtrend.
Also, we will observe that there is a formation of a lower low both on the chart and on the indicator and that serves as a confirmation of the downtrend continuation.
- Screenshot
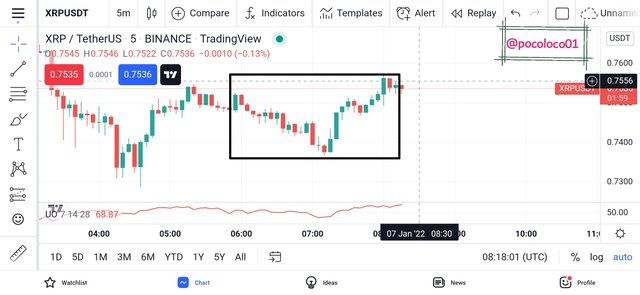
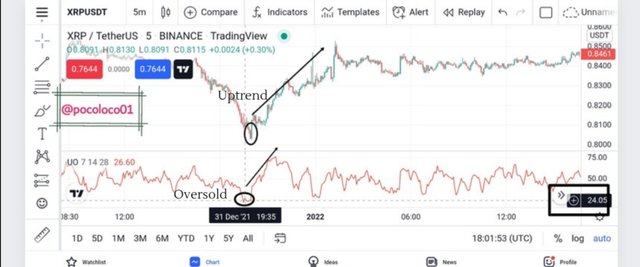
- IDENTIFICATION OF UPTRENDS
Identification of uptrend is similar but opposite to the identification of downtrends. In the identification of uptrends, we first observe the indicator to be at the oversold region which is below the 30 mark.
When it is at the oversold region, it indicates that the trend will move upwards and continue in an uptrend movement.
Also, there is a formation of higher high both on the chart and on the indicator and that serves as a confirmation to the uptrend continuation.
- Screenshot
| ULTIMATE OSCILLATOR | SLOW STOCHASTIC OSCILLATOR |
|---|---|
| The Ultimate oscillator is unique in the sense that it makes use of three periods during analysis. | It is not a unique momentum indicator because it makes use of a single period which is similar to other momentum indicators. |
| The fact that the Ultimate Oscillator makes use of multiple periods makes it reduce its number of signal generation thereby reducing the chances of false signals. | The Slow Stochastic Oscillator generates multiple signals because it makes use of a signal period. This generates multiple signals thereby increasing the chances of false signal production. |
| The Ultimate Oscillator Indicator makes use of a single Oscillating line | The Slow Stochastic Oscillator makes use of a double oscillating line. |
| Similar is RSI, the Ultimate Oscillator Indicator makes use of the 70 and 30 marks as overbought and oversold regions respectively | The Slow Stochastic oscillator makes use of the 80 and 20 marks as overbought and oversold regions respectively. |
QUESTION 3
The use of indicators in cryptocurrency trading is effective but not completely accurate. For this reason, a trader is required to not just master the use of indicators but also learn the use of the price action technique in interpreting market actions.
The use of indicators and price action techniques go hand in hand as one serves to confirm the possible price movement as indicated by the other (confluence).
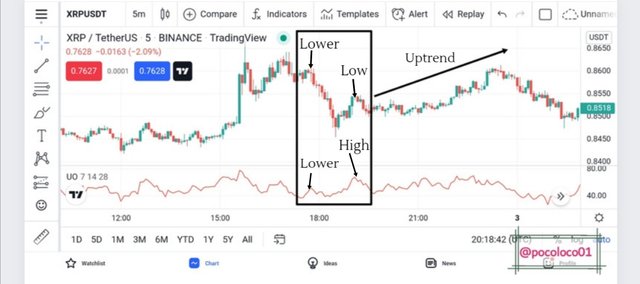
Divergence occurs when an indicator provides a signal contrary to what is being shown by the price chart. This can be regarded as a false signal but with clear observation, it becomes only but a signal for trend discontinuation.
When divergence occurs, it indicates that a current trend is weak and prone to a possible reversal regardless of the formation of higher highs and lows on either the price chart or the indicator but not both.
Identifying divergence in the market using the Ultimate Oscillator Indicator is similar to the method used by other momentum indicators.
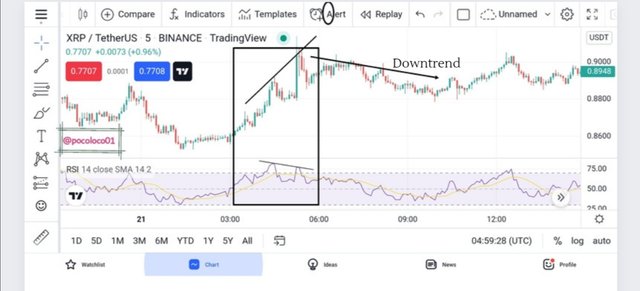
- BULLISH DIVERGENCE
A Bullish Divergence occurs when the price of an asset moves in a bearish trend forming lower lows which serve as an indication of a continuous downtrend. At the same time, the indicator moves in an uptrend forming a higher high or a lower high which is an indication of an uptrend.
When the above happens, it signals that the current downtrend is weak and prone to a possible reversal.
- Screenshot
- BEARISH DIVERGENCE
A Bearish Divergence occurs when the price of an asset moves in a bullish trend forming higher highs and simultaneously, the indicator moves in a downtrend forming a lower low which is an indication of a downtrend.
When the above happens, it signals that the current uptrend is weak and prone to a possible bullish-to-bearish trend reversal.
- Screenshot
Aside from using the Ultimate Oscillator Indicator to identify divergence in the market, several other indicators can be used and a good example is the Relative Strength Index (RSI).
The RSI is a momentum indicator that was developed by J. Welles Wilder. It works similar to the Ultimate Oscillator by helping traders to evaluate the current strength of an asset.
It is used in the identification of overbought and oversold regions which in turn signals a trader on when to either buy or sell an asset.
It also identifies divergence by signaling what is contrary to the price chart. This divergence serves as a signal for a current trend reversal.
- Screenshot
Looking at the above, we will observe that the price chart made a higher high formation which is a signal for a continuous downtrend while the RSI Indicator formed a lower low which is a signal for a trend reversal.
Seeing that the price chart and indicator are indicating what is contrary to each other, it is termed a divergence.
This divergence is what now tells us that despite the forming of higher highs on the price chart, the current bullish trend is weak and as such be avoided because it is prone to a possible reversal.
QUESTION 4
Taking an entry or exist on the market using Ultimate Oscillator Indicator takes advantage of trend reversals which are mostly identified by divergences.
In other to take an entry or exit from the market, three steps/conditions are to be met and they include;
Confirmation of divergence
Making sure that the price is at the overbought or Oversold region
Making sure that the indicator rises above or below the divergence
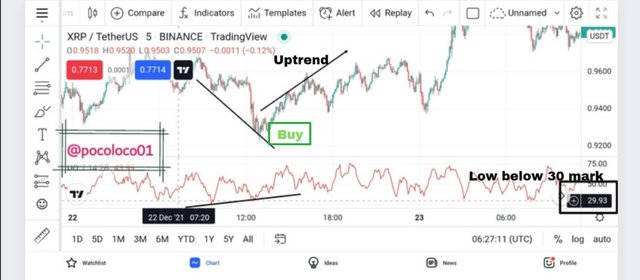
- BUY POSITION
For a bullish signal, we have to first confirm a bullish divergence in the market. This happens when the price moves in a bearish trend and the indicator move in a bullish trend.
Secondly, we observe to see that the first low must be at the oversold region ie below the 30 mark.
Lastly, the indicator must rise above the point between two lows of the divergence (divergence high).
- Screenshot
- EXIT
The Stop-loss is to be set a little below the last low of the price chart and the Target set in consideration of the Stop-loss in a ratio of 1:1, 1:2 or 1:3 based on the choice of the trader.
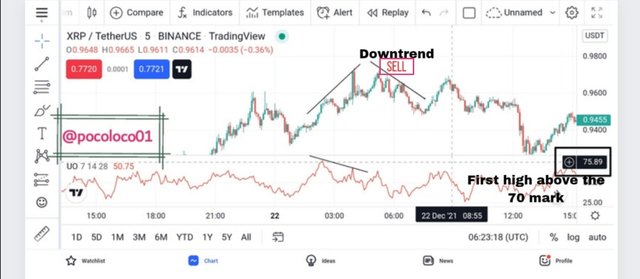
- SELL POSITION
For a bearish signal, we have to first observe a bearish divergence in the market. This happens when the market is trending upwards with a formation of higher highs and at the same time, the indicator is showing a bearish signal with a formation of lower low.
Secondly, we observe to see that the first high must be at the overbought region ie above the 70 mark.
Lastly, the indicator must go below the point between two highs of the divergence (divergence lows).
- Screenshot
- EXIT
The Stop-loss is to be set a bit above the last high of the price chart and the Target set in consideration of the Stop-loss in a ratio of 1:1, 1:2, or 1:3 based on the choice of the trader.
NOTE: The Target should be set to be equal or greater than the stop-loss in other to ensure proper trade management.
QUESTION 5
- MY OPINION
Ultimate Oscillator Indicator is an efficient momentum-based indicator that provides a more accurate signal due to its reduced signal production as a result of the multiple periods it makes use of.
These multiple periods add a reduction in sensitivity to the indicator thereby making it unable to identify minor reversals. This lack of identification of minor reversals helps to reduce false signals as most of these minor reversals are short-lived.
The Ultimate Oscillator Indicator works similar to the RSI indicator in identifying overbought and oversold regions by making use of the same 70-above and 30-below marks as the overbought and oversold regions respectively.
These marks allow traders to easily identify when an asset is being oversold or overbought and in turn signal them on best trading position to take.
Nevertheless, the Ultimate Oscillator Indicator should be combined with other technical analysis tools such as the Exponential Moving Averages for easy trend identification which will help to maximize profit and minimize loss.
- BEST TIME-FRAME
Talking about the timeframe, both scalpers and swing traders can make use of the indicator in trading. But in other to trade on more signals, I would recommend a shorter timeframe ranging from 1min to 1hr.
This is because the Ultimate Oscillator Indicator is less sensitive due to the multiple periods it uses and its signal generation becomes less obvious as the timeframe increases.
CONCLUSION
The Ultimate Oscillator Indicator is a technical indicator that was developed by Larry Williams in 1976. It makes use of values that fluctuates between 0-100 and with the level above 70 and the one below 30 serving as overbought and oversold regions respectively.
Being a momentum indicator, it is based majorly on identifying the level of momentum on asset prices thereby signaling a trader on when to buy or sell an asset.
Unlike other momentum indicators, the Ultimate Oscillator Indicator makes use of multiple periods which makes it less sensitive to reversals especially minor ones. This less sensitivity reduces its chances of providing false signals when compared to other momentum-based indicators such as RSI and Stochastic Oscillator.
It also identifies divergences that occur when the price moves in contrary to the indicator. This divergence in turn serves as a major signal for possible trend reversal.
Once again, another awesome lecture by Professor @utsavsaxena11.
Thanks!