[Crypto Trading With Chaikin Money Flow Indicator]- Crypto Academy S4W6 - Homework Post for professor @kouba01

Hello Steemians, I hope you all are having a fantastic day. Prof @kouba01 gave detailed information on the technical indicator Chaikin Money Flow and identifying trade signals using the indicator.

Question 1: In your own words, give a simplified explanation of the CMF indicator with an example of how to calculate its value?
Chaikin Money Flow Indicator (CMF)
The Chaikin Money Flow indicator is an indicator that was developed by Marc Chaikin to measure the money flow into and out of a security over a set period. In addition, this indicator is used to measure the buying and selling pressure present in a security over a set period.
The standard period for Chaikin Money Flow is 21 days, the CMF can be used to confirm trend and predict trend reversals using the flow of money (volume) and price movements.
The CMF indicator has a line that moves within points +1 to -1 with 0 being the half-line (midpoint). When the CMF line moves closer to point +1, it indicates high buying pressure as there is an inflow of money into the asset. In the same vein, if the CMF line approaches the -1 line, it's an indication that there is selling pressure as there is an outflow of money away from the asset.
Calculation of the CMF Indicator
The Chaikin Money Flow Indicator can be calculated using a mathematic formula developed by the creator of the indicator Marc Chaikin. The formula is given below.
Where:
Closing Price = Closing price of the day
High Price = Highest price of the day
Low Price = Lowest price of the day
There is an alternative method used to calculate the Chaikin Money Flow, and it involves 3 steps that include the money flow multiplier and the money flow volume.
1.First Step - Calculate For The Money Flow Multiplier.
Close = Closing price of a period
High = The highest price of a period
Low = The lowest price of a period
The Money Flow Multiplier (MFM) is calculated when the lowest price is subtracted from the closing price minus the closing price deducted from the highest price, divided by the difference between the highest price and the lowest price.
2.Second Step - Calculate for the Money Flow Volume.
The Money Flow Volume (MFV) can be calculated by multiplying the money flow multiplier by the period volume.
3.Third Step - Calculate for Chaikin Money Flow
Using an example to explain the Chaikin Money Flow Indicator calculations better. Taking the set period as 21 days
Closing Price = $23,761.83
Highest Price = $23,922,66
Low Price = $23,133.38
Period Volume = $71,376
Total period volume = $19.64 Million
Calculate for the Money Flow Multiplier
Money Flow Multiplier = [($23,761.83 - $23,133.38) - ($23,922,66 - $23,761.83)]/($23,922.66 - $23,133.38)
= 467.62/789.28
= 0.59
Next, calculate the Money Flow Volume by multiplying the MFM by the period volume.
Money Flow Volume = 0.59 x $71,376
Money Flow Volume = 42,111.84
Lastly, calculate for the Chaikin Money Flow
Chaikin Money Flow = 42,111.84/19.64 million
Chaikin Money Flow = 0.002 = 0.
The CMF line is on the midpoint or 0 line.
Question 2: Demonstrate how to add the indicator to the chart on a platform other than the tradingview, highlighting how to modify the settings of the period(best setting). (screenshot required)
Adding The CMF Indicator On A Chart Using Cryptowatch
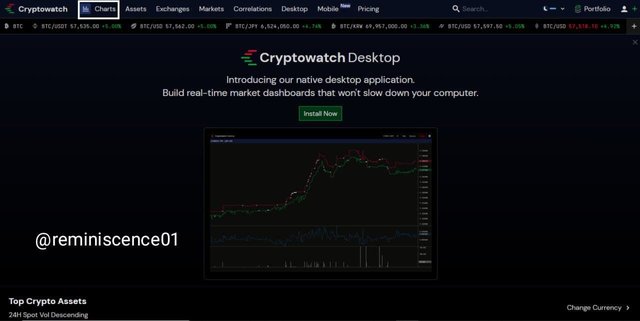
Cryptowatch is a crypto charting tool, and I will be using it to illustrate how the Chaikin Money Flow Indicator is added to the chart.
The first step is to visit the Cryptowatch platform. Then, on the homepage, click on the chart.
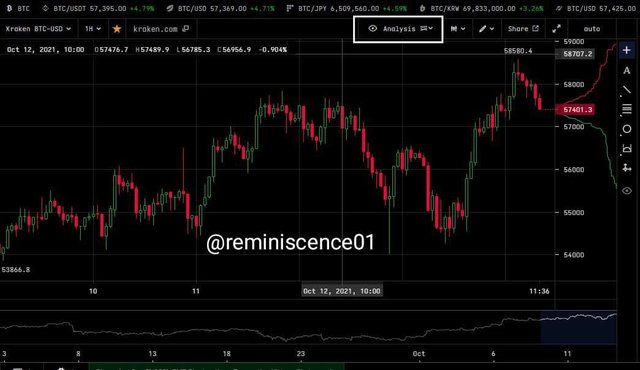
After clicking on the chart, the chart page opens and then click on Analysis to search for indicators below.
After clicking on the analysis button, a search box will pop up. On the search box, type Chaikin Money Flow and click on it as it appears.
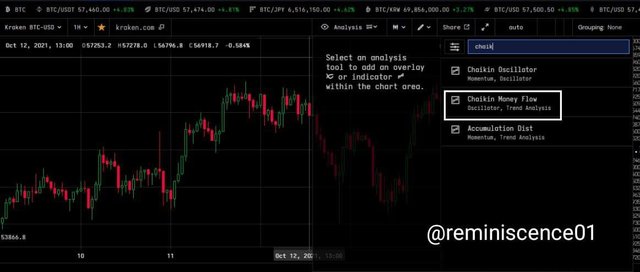
Once the CMF indicator is clicked, it is immediately added to the chart, as seen below.
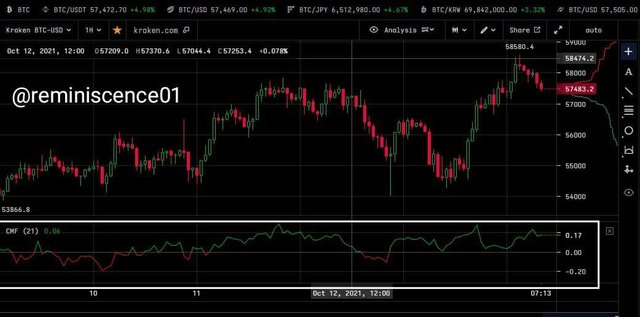
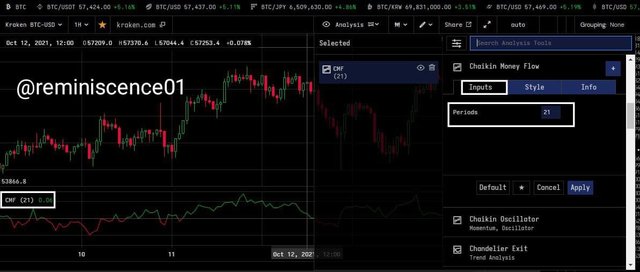
The CMF Indicator is added to the chart. To make the necessary settings, click on the CMF indicator bar to open up the settings. On the setting section under inputs, select 21 as the preferred period.
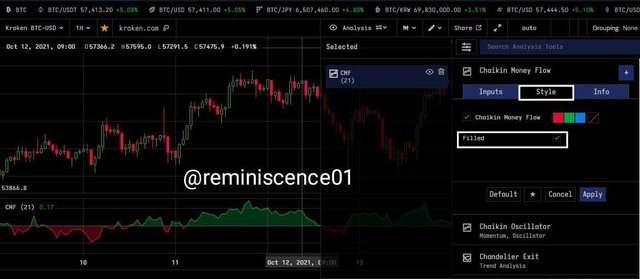
Next, select style; in this section, the colour bands for the CMF indicator is chosen. Also, I clicked on fill to fill up the CMF line, as shown below.
Regarding settings, though the default and standard periods are 20 or 21, any trader can decide to select a period that best suits their trading strategy.
Question 3: What is the indicator's role in confirming the direction of the trend and determining entry and exit points (buy/sell)؟(screenshot required)
Confirming Trends Using the CMF Indicator
The CMF Indicator can confirm trends as there is a good correlation between price movement and the flow of money in and out of an asset. If money flows into an asset, this indicates buying pressure, increasing demand leading to an uptrend in price action.
Also, if there is an outflow of money from an asset, this indicates selling pressure, leading to a decrease in demand and an increase in supply. The selling pressure brings about a downtrend movement in price action.
The CMF line moves between the +1 line and the -1 line. When the CMF line moves closer to the +1 line, it indicates that money is moving into the asset, confirming the uptrend; when the CMF line moves closer to the -1 line, it shows that money is moving out of the asset, confirming the downtrend.
Using CMF Indicator To Determine Trade Entry/Exit Points
The CMF Indicator is used to determine entry and exit points in trades. The CMF line crosses above the 0 lines (midpoint) to indicate an increase in the buying pressure and an accumulation of the assets. When the CMF line crosses below the 0 lines to indicate the rise in the selling pressure and distribution of the assets.
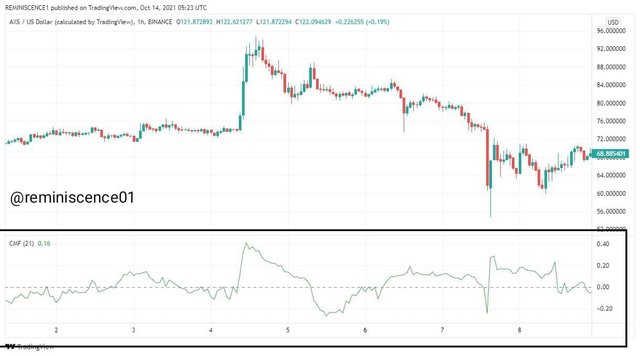
Sell Entry and Exit Point AVAXUSDT
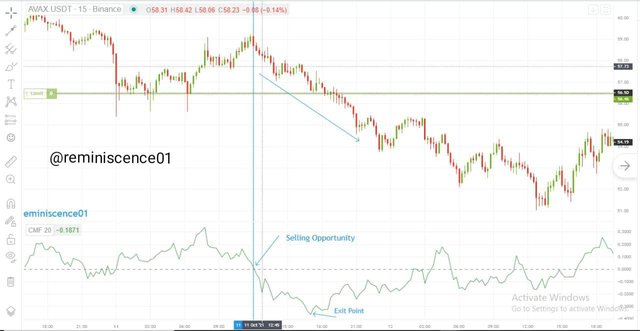
On the AVAXUSDT chart, the CMF line crosses below the 0 lines to indicate that money is leaving the asset as there is an increase in selling pressure. The point where the CMF line crosses below the 0 lines is an entry point for a sell order and the exit point is when there is a reverse in the direction of the CMF line.
Buy Entry and Exit Point ETHUSDT
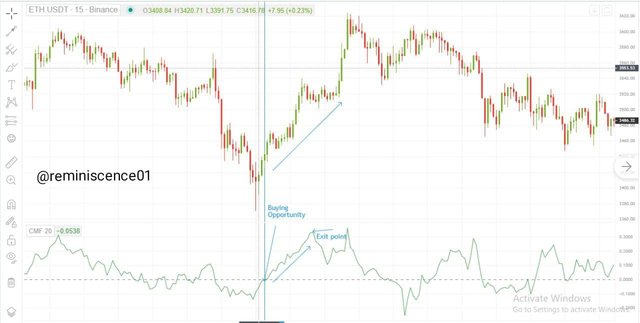
On the ETHUSDT chart, the CMF line crosses above the 0 lines to indicate that money is entering the asset as there is an increase in buying pressure. The point where the CMF line crosses above the 0 lines is an entry point for a buy order and the exit point is when there is a reverse in the direction of the CMF line.
Question 4: Trade with a crossover signal between the CMF and wider lines such as +/- 0.1 or +/- 0.15 or it can also be +/- 0.2, identify the most important signals that can be extracted using several examples. (screenshot required)
Trading Signals Using CMF Crossover Signals.
The crossover strategy is the crossing of the CMF line between wider lines like +/- 0.1, +/- 0.15, and +/- 0.2 depending on the volatility of the asset.
The crossover strategy can be used to identify a buy signal when the CMF line moves from below the -0.1 and crosses above the +0.1 line. Conversely, when the CMF line crosses above the +0.1 line, a buy order should be executed.
To identify a sell signal, the CMF line moves from above the +0.1 and crosses below the -0.1 line. When the CMF line crosses below the -0.1 line, a sell order should be entered.
For a better illustration of the crossover strategy, I will be showing some examples.
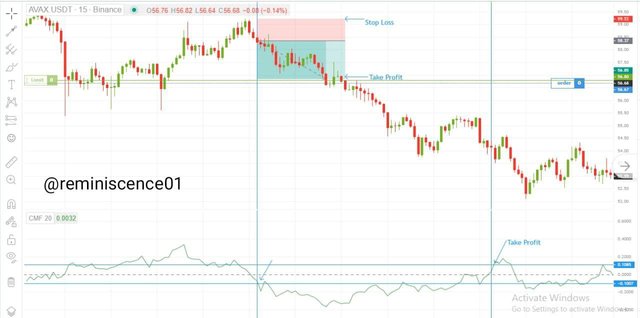
Sell Signals Using The Crossover Strategy
On the AVAXUSDT chart, the CMF line moved sharply from above the +0.1 line and crossed below the -0.1 line. A sell order is placed, and trade is executed. A stop-loss can be placed at the previous high line, and take profit is set using 1:1 or 1:2 as used here. Also, take profit can also be placed when the CMF line crosses the +0.1 line.
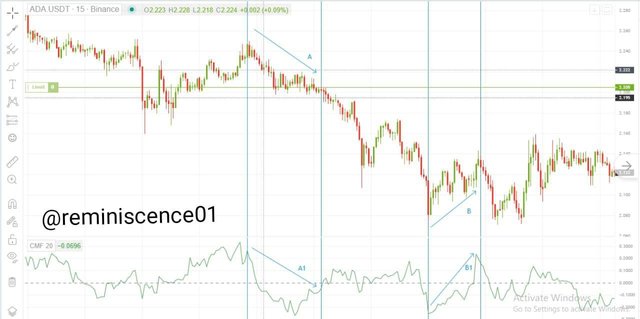
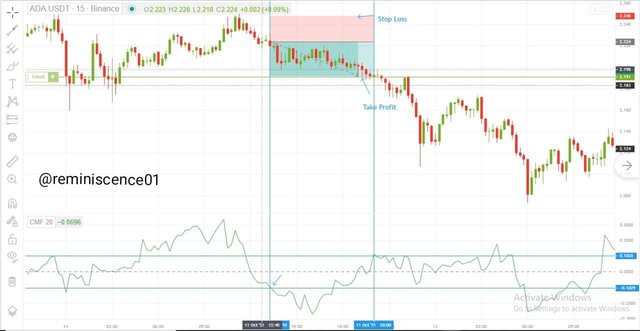
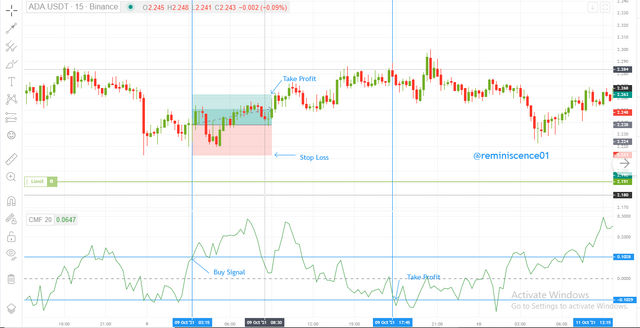
Another example of a sell signal using the crossover strategy is shown below on the ADAUSDT when the CMF line crossed below the -0.1 from above the +0.1 line. Again, the stop loss was placed on the last high line and take-profit when the CMF crossed the +0.1 line.
Buy Signals Using The Crossover Strategy
On the ADAUSDT chart, a buy signal was given using the crossover strategy when the CMF line crossed above the +0.1 line from below the -0.1 line. The stop loss was placed at the previous low and take-profit using 1:1 or when the CMF line hits the -0.1 line.
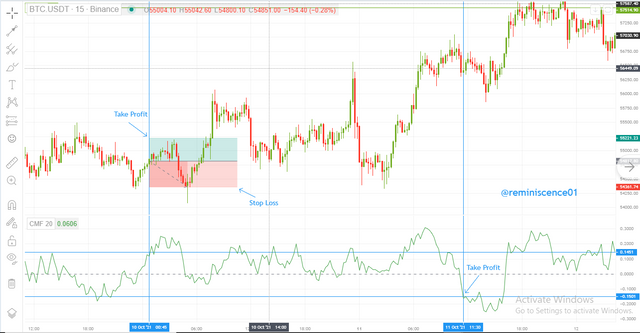
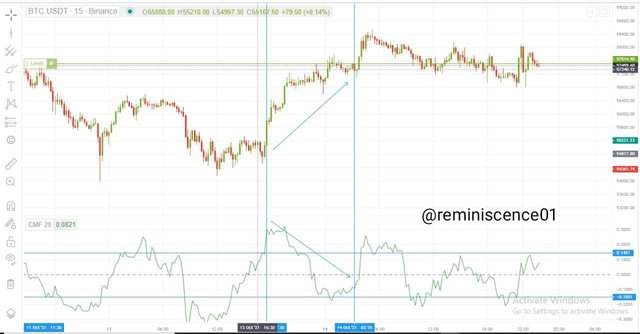
Another example using the +/-0.15 line on the BTCUSDT, the CMF line crossed above the +0.15 line from below the -0.15 line. The stop profit was placed at the previous low and take-profit using 1:1 or when the CMF line reverses to the -0.15 line.
The crossover strategy is impressive because it gives an accurate signal without depending on the current trend.
Question 5: How to trade with divergence between the CMF and the price line? Does this trading strategy produce false signals?(screenshot required)
Trading Signals Using CMF Divergence Signals.
The divergence between the CMF line and price movement gives a trade signal as it indicates a probable trend reversal leading to a trade signal. There are 2 types of divergence, namely, the bullish divergence and the bearish divergence.
A bullish divergence occurs when the CMF line moves in an uptrend indicating an inflow of money into the asset as buying pressure increases and price moves in a downtrend. A trend reversal I incoming as the increased buying pressure due to the inflow of money will trigger a trend change in price from a downtrend to an uptrend.
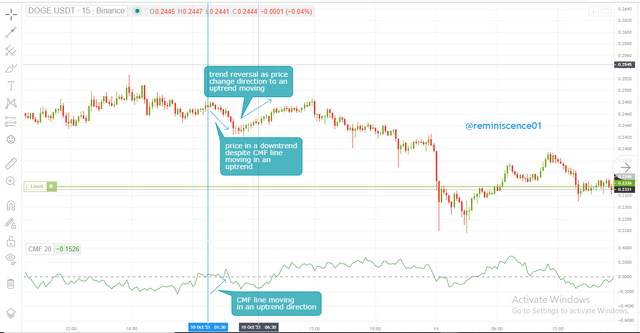
On the DOGEUSDT, the CMF line moved at an uptrend, and the price continued in a downtrend movement. The movement of the CMF line in an uptrend indicates an increase in buying pressure leading to an eventual rise in price, as shown above.
A bearish divergence occurs when the CMF line moves in a downtrend, indicating an outflow of money into the asset as selling pressure increases and price moves in an uptrend. A trend reversal is incoming as the increased selling pressure due to the outflow of money will trigger a trend change in price from an uptrend to a downtrend.
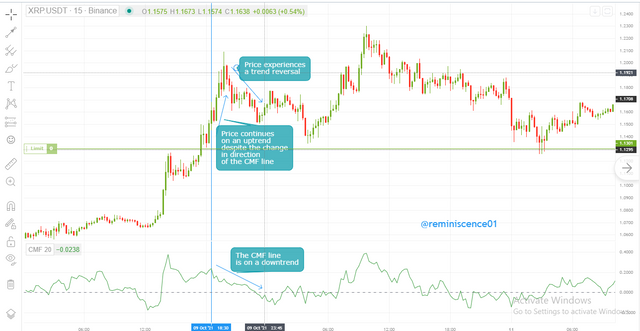
On the XRPUSDT, the CMF line moved at a downtrend, and price continued in an uptrend movement. The movement of the CMF line in a downtrend indicates an increase in selling pressure leading to an eventual decrease in price, as shown above.
False Signal Given By The CMF Divergence Strategy
The CMF divergence trading strategy do give false signals as the price won't experience a trend change after the divergence. An example is given below.
On the BTCUSDT chart, the price was on an uptrend, and the CMF line was on a downtrend, indicating a bearish divergence. However, the divergence trade signal was a false signal because the price continued in an uptrend movement and the CMF line reversed to an uptrend movement.
The CMF indicator can be paired with other technical indicators when using the divergence strategy.
Conclusion
The CMF indicator is used to measure the flow of money in and out of an asset to confirm trends and predict trade signals. The CMF indicator is a volume-based indicator that can confirm trends when the CMF line moves in the same direction as price.
There are a couple of trading strategies used to give trade signals using the CMF indicator. Examples of techniques used include the crossover strategy and the divergence strategy.
Thanks, prof @kouba01, for a fantastic lesson.
https://steemit.com/hive-108451/@theoxl/trading-cryptocurrencies-crypto-academy-s4w6-homework-post-for-reminiscence01 please read the comment professor
Hello @reminiscence01,
Thank you for participating in the 6th Week Crypto Course in its 4th season and for your efforts to complete the suggested tasks, you deserve a Total|7.5/10 rating, according to the following scale:
My review :
A good article in which you were able to answer most of the questions seriously, and you have some notes that I made.
A simplified explanation of the CMF indicator.
You gave a clear example but it is not correct where you have to provide the results of the previous period 20 to get the result of the period 21.
Thanks again for your effort, and we look forward to reading your next work.
Sincerely,@kouba01
Thank you @kouba01.
Hello prof @reminiscence01, hope you are doing well and safe?
pleases sir pardon me for this,I just wat to bring your attention to you given homework task season four week six, however,I have been part-taking in the given tasks by professors but nor of my work is graded nor upvoted, and my sp is 215, I traded my sbd to achieve this so I can meet with the requirement for the steemit crypto academy, but still my work is not judged to be able to know my errors. this worry's me. meanwhile, I was libel by @sapwood for task 4 but not graded or upvoted
Here is the link to your given homework task please kindly help me know my wrongs so I can work on it
Thank you so much
Best regards
@gracellagift
https://steemit.com/hive-108451/@gracellagift/crypto-academy-s4w6-homework-post-for-prof-reminiscence01-student-by-gracellagift