[CRYPTO TRADING STRATEGY WITH MEDIAN INDICATOR] - Steemit Crypto Academy - S6W4 - Homework post for Professor @abdu.navi03 by @robbee
Hello steemian ...
This is my new post in the Steemit Crypto Academy community, on this season 6 week 4, I will be working on a homework from professor @abdu.navi03 with the theme "Crypto Trading Strategy With Median Indicator”.

we will discuss it through the homework below:

1.) Explain your understanding with the median indicator.
In the world of trading, there are various analytical techniques that traders can use to gain profits in trading. Technical analysis is an analytical technique that is often used by traders to predict price increases or trends in a market, traders usually observe patterns of price increases that can be used as a basis for selling or buying. One of the technical analyses is using the indicator technique. Indicator techniques are tools created from mathematical calculations in the form of a line or the like on a price chart that can help traders assess market conditions so that traders can predict future price charts. Simply put, the indicator technique helps us to get buy and sell signals on the price chart. We can also use this indicator technique to confirm the analysis that we have done so that we can be more confident in making decisions.
Indicators have two basic properties that we must know, the two basic properties of these indicators are leading and lagging. Each indicator only has one of the two properties, for example when a certain indicator has a leading character, the indicator does not have a lagging nature, and vice versa. Leading indicators use data that has happened before to predict future prices which cause these indicators to signal market entry more quickly. The lagging indicator uses the previous price action data to read the direction of the trend, this lagging indicator is more famous as a trend direction indicator or trend following indicator. Many indicators apply leading and lagging properties, one of the indicators that have lagging properties is the median indicator which we will discuss this time.
The median indicator is one of the lagging indicators that helps us to know the direction of the trend. As the name itself suggests, the median is the middle value, which means the median indicator helps us to find out the direction of the trend with the median indicator's middle value. Besides helping to know the direction of the next trend, the median indicator can also help to see market volatility. The media indicator has several parts, the orange line in the middle is the median of the indicator, the green line at the top is the upper band, the purple line at the bottom is the lower band, the thin blue line is the EMA medium, and most importantly ATR ( Average True Range) which has two thick green or purple colors located in the middle. For a clearer view of the median indicator display, it can be seen in the image below.
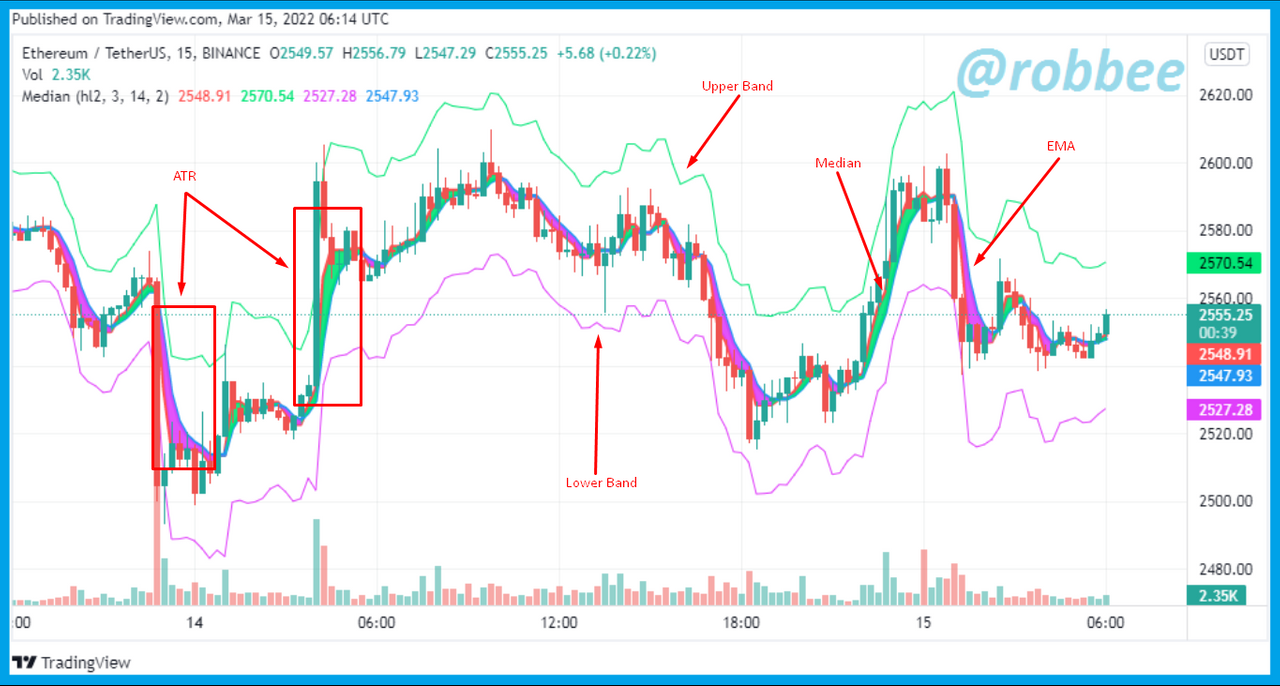
As can be seen in the example of the median indicator image above, we can see that there are many colors and lines, each color and line has different uses. Previously I explained that the median indicator apart from providing information to find out the direction of the trend, the median indicator can also help provide information on market volatility. To find out the volatility that occurs in the market, we can use the upper band and lower band on the median indicator. For more details, see the picture I marked below

As can be seen in the two locations that I marked with a square above. Volatility is said to be high if the distance between the upper and lower bands is far, while volatility is said to be small when the distance between the upper and lower bands is close. In conclusion, when the upper band distance is further away, the volatility is higher. On the other hand, if the upper band distance is getting closer, the volatility is getting smaller.
To find out the direction of the trend that is happening in the market using the median indicator, we only need to look at the ATR color that is formed on the median indicator. For more details, see the image below.

As can be seen in the image above, there are two ATR colors, namely green and purple. When the ATR has a green color, it means a bullish trend will form, while when the ATR has a purple color, a bearish trend is formed.
To use the median indicator on the trading platform is very easy, we only need to click on the indicator section, then on the search form type the median text, then click on the median indicator, and the median indicator will be installed on the trading platform. for more details can be seen in the image below, in the image below using the trading platform view.


2.) Parameters and Calculations of Median indicator. (Screenshot required)
Parameters on the median indicator can be seen by pressing the settings on the median indicator, the parameters that we can enter manually are Median Length, ATR Length, and ATR Multiplier. For more details, see the image below.

As can be seen in the image above, the three parameters above have default numbers and of course, they can be changed according to the wishes of the user. Every time we change the number of the median indicator parameters, it will certainly change the shape and information provided by the median indicator.
Apart from the 3 initial parameters above, of course, several parameters are formed through the formula and previous market data, such as the Median EMA, Median value, upper band, and lower band. The formula for each parameter that we cannot input manually can be seen below.
Median Value = highest price + lowest price / 2
Median EMA = ((closing price) x (2/(number of days in EMA+1))) + (one day's previous EMA x (1-(2/(number of days in EMA+1)))))
From the two formulas above, an ATR is formed where when the EMA value is above the median value, the ATR is purple, otherwise, if the EMA value is below the median value, the ATR is green.
Meanwhile, the formula for the upper band and lower band is obtained from the data that we input manually on the 3 initial parameters of the median indicator.
Upper Band = median length + (2ATR)
Lower Band = Median length – (2ATR)
Apart from the 3 basic parameters of the median indicator that can be changed according to need, the median indicator also gives us the freedom to determine the citizens of the five sections of the median indicator, to change the display color of the median indicator can be seen in the settings then press style, then we can make changes display color of the median indicator.

3.) Uptrend from Median indicator (screenshot required)
As the initial explanation that the median indicator is a lagging indicator which means a trend indicator, therefore this median indicator will give a signal of a bullish or bearish trend. A bullish trend or uptrend occurs when the three Median lines (orange) are above the EMA line (blue line), when the Median is above the EMA, the ATR will be green, which means the trend is bullish or uptrend. When we already know how to see an uptrend using the median indicator, then we also have to know where is the right time to make an entry buy. Doing a buy entry using the median indicator can be done when the Median line starts to cross the EMA line from the bottom, for more details, see the image below.

As can be seen in the picture above, when the median line starts to cross the EMA line from the bottom and the ATR color changes to green it is a suitable time to enter the market. In the example above the median line crosses the EMA line from the bottom at 2556.38 USDT on the ETH/USDT coin. For the placement of stop loss and take profit using the median indicator whether or not there is a provision, therefore we can take profit when the median line crosses the EMA line again from the top as in the example above where the median line crosses back the EMA line from the top at 2757.36 USDT, so the profit is 7.85%.
4.) Downtrend from Median Indicator (screenshot required)
Previously we already knew how to identify a bullish trend or an uptrend using the median indicator, when an uptrend we can enter a buy on the market. Apart from the uptrend, of course, the market also has a bearish trend or a downtrend. The downtrend on the median indicator occurs when the EMA line (blue line) crosses the median line (orange line) from the bottom and the ATR has a purple color, if this happens on the price chart then the market is in a bearish trend or downtrend. Because we already know how to identify a downtrend on the median indicator, then next we also have to know what time is suitable for a sell entry when there is a downtrend on the median indicator. A sell entry can be made when the EMA line starts to cross the median line from the bottom, for more details, see the picture below.

As can be seen in the picture above, when the EMA line starts to cross the median line from the bottom and the ATR changes color to purple, then it's a good time to enter the market. In the example above, the EMA line crossed the median line from the bottom at 2727.85 USDT on the ETH/USDT coin. For the placement of stop loss and take profit, it is the same as when the median indicator is in an uptrend, namely, there are no rules for placing stop loss and take profit, but we can take profit when the EMA line crosses back the median line from the top, in the example above take profit inside was taken at 2365.34 USDT, so the gain was 13.29%.
5.) Identifying fake Signals with Median indicator(screenshot required)
When discussing the issue of indicators to get entry signals, we will never forget to discuss false signals. This false signal is an entry signal given by the technical analysis used but the result of the signal does not match the given signal. For example, when we use the median indicator to find out the trend on the chart so that we can enter at the right time when the median indicator gives a signal that the chart will be bullish then we as traders will make a buy entry, but in fact, the chart is bearish, which means the signal given by the indicator is false or false.
We will often encounter false signals when doing technical analysis, what we have to do is minimize these false signals. We will often encounter false signals when we only perform one technical analysis without using other technical analyses to confirm the signal given by the technical analysis we use. Another example is when we only use the median indicator to get an entry signal when the median indicator gives an entry signal, then we don't know whether the signal is fake or not, to find out if the signal is fake or not we can confirm the signal by using other technical analysis or using other indicators.
The way we know false signals or correct signals when using the help of other technical analyses or other indicators is that the signals given by both indicators or other analyzes are the same, meaning that when the median indicator gives a bullish signal, the other indicators give the same bullish signal. this is a true signal, otherwise, if the two indicators or other technical analyses give different signals then the signal is a false signal.
From some of the previous explanations, we can conclude that when using the median indicator we should add other indicators to confirm the signal given by the median indicator. Although the median indicator is an indicator with lagging properties or provides information about trends, we don't have to use indicators with the same nature, we can combine lagging and leading indicators, for more details on how to identify false signals can be seen in the example image below.

In the example above I combined the median and RSI indicators. As we know that the median indicator is a lagging indicator and the RSI is a leading indicator. To repeat a bit about the RSI indicator, the RSI indicator gives a buy entry signal when the RSI chart is below 30 and a sell entry signal when the RSI chart is above 80. In the picture above we can see that the median indicator signals a bearish trend because the ATR is purple, which means we can make a sell entry, then on the RSI indicator, we can see that when the median indicator gives a bearish signal which means a sell entry but the RSI indicator gives a buy entry signal because the RSI chart is below 30. Due to the two indicators giving different signals, we should not enter the market.
Apart from the examples of false signals above, I will also provide examples of true signals in addition. Previously I have explained that the signal is said to be true when both indicators give the same signal, for more details, see the image below.

As can be seen in the picture above, the area I marked on the median indicator is a buy entry signal given by the median indicator because the median line crosses the EMA line from the bottom and the ATR is green which means the chart will be bullish. Then when the median indicator gives a bullish signal or buys entry, we can look at the RSI indicator where the chart on the RSI indicator is below the value of 30 which means a buy entry. Both indicators give the same signal, namely a buy entry, so we can conclude that the signal given by the median indicator is the correct signal.
6.) Open two demo trades, long and short, with the help of a median indicator or combination that includes a median indicator (screenshot required)
To solve this question I will use two platforms namely tradingview and Binance. I use both platforms because the Binance platform does not have a median indicator, therefore I will use tradingview to do technical analysis of indicators and the Binance platform as a platform to execute trades. Here I will also use two indicators, namely the median indicator and the RSI indicator.
Entry buy
To do this entry buy I use the ZEC/USDT coin. For more details, see the image below.

The picture above is a chart of the ZEC/USDT coin with a 1-hour timeframe on the tradingview platform. We can see in the chart above when the median line is starting to cross the EMA line from the bottom and the ATR is green, it means the median indicator is giving a signal that the chart will be bullish and also giving a buy entry signal. Furthermore, on the RSI indicator, when the median indicator gives a signal to make a buy entry, we can see on the chart the RSI indicator was below the value of 30 which means a buy entry signal. Because both indicators gave the same signal, I made a buy entry, due to the absence of stop loss and take profit provisions, I decided to make a 1:1 stop loss and take profit comparison. That way I made an entry buy at the price of 144 USDT with the amount of 0.069 ZEC. Then I placed my take profit at 148.2 USDT and placed my stop loss at 139.8 USDT.

Entry Sell
To do a sell entry I use a different coin when I enter a buy. I use the BCH/USDT coin to make a sell entry. For more details, see the image below.

In the picture above is a chart on the BCH/USDT coin with a 45-minute timeframe on the tradingview platform. The median indicator in the picture above does not provide a sell entry signal, but there are already several signals that the chart will decline. First, we can see on the chart that the RSI indicator is already above the value of 80, which means a signal for a sell entry. Then we can look at the candle that is formed, when the RSI indicator gives a downtrend signal, we can see the rejection candle is formed which provides information about a reversal in the direction of the trend which was previously an uptrend after the rejection candle is formed then an impulsive bearish candle is formed which means the bearish trend will continue. Because there are already several signals that a downtrend will occur, I immediately take a sell entry action before the median indicator gives a signal because I believe that the next candle will make the median indicator give a sell entry signal. I made a sell entry at the price of 292 USDT and the amount of 0.041 BCH. Just like in the buy entry, I made a take profit and a stop loss in a ratio of 1:1, so I placed a take profit for 287.5 USDT and a stop loss for 296.5.

In the previous picture, the median indicator has not yet given a sell entry signal, so I will display a follow-up image showing that the median indicator gives a sell entry signal.

Conclusion
Indicators are tools that can help us perform technical analysis to get the right entry and exit signals. Apart from being a tool for conducting technical analysis, indicators can also be used as a tool to confirm signals given by other technical analyses. Indicators have two kinds of properties, namely leading and lagging. Leading indicators provide entry signals quickly while lagging indicators help us more in reading the direction of the trend. One of the types of lagging indicators is the median indicator. The median indicator is one of the lagging indicators that can provide two pieces of information at once, the first information is the direction of the trend and the second information is market volatility.
The median indicator has 5 parameters, namely the upper band, lower band, median, EMA, and ATR. The five median indicator parameters have their respective formulas and their respective uses. To read market volatility, the upper and lower bands will be used, while to read the direction of the trend, the median, EMA, and ATR will be used. To find out whether high or low market volatility can be seen using the upper and lower bands, the greater the distance between the lower and upper bands, the higher the market volatility, on the other hand, if the distance between the upper and lower bands is smaller, the market volatility will be lower.
To find out the direction of the next trend using the median indicator, we only need to look at the 3 parameters of the median indicator, namely the median line, EMA line, and ATR. The trend is bullish or uptrend if the median line crosses the EMA line from the bottom and the ATR has a green color. The trend is bearish or downtrend if the EMA line crosses the median line from the bottom and the ATR has a purple color. When we already know how to identify uptrend and downtrend using the median indicator, we should never forget false signals. When we only use the median indicator to find out the direction of the next trend, the percentage we get false signals will be greater, therefore to minimize getting false signals we can use additional indicators such as RSI and others. The signal is said to be false if the two indicators give different signals and the signal is said to be true if both indicators give the same signal.
References:
https://www.tradingview.com/chart/ITAaNOcQ/
https://www.binance.com/en/trade/BCH_USDT?layout=pro
https://www.binance.com/en/trade/ZEC_USDT?layout=pro
@tipu curate 2
Upvoted 👌 (Mana: 2/6) Get profit votes with @tipU :)