[Technical indicators] - Crypto Academy / S4W2- Homework Post for @reminiscence01 by @ryzsfa
Good day steemians,
It’s an honor being part of this season 4 episode of the steemit crypto academy community and I’m very grateful. Proceeding to present my homework post, I would like to acknowledge professor @reminiscence01 and other professors for thier hard work and I sincerely appreciates the steemit crypto Academy community for the support.
Today’s topic is Technical indicators. Here is my homework presentation based on the questions given.
1 a) In your own words, explain Technical indicators and why it is a good technical analysis tool.
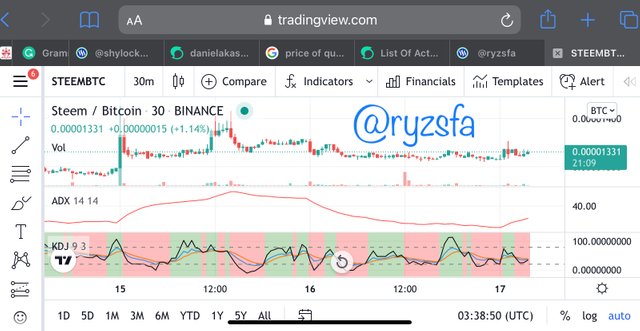
Technical indicator are tools used by investors or expert traders to make critical analysis of charts of a crypto asset. These analysis involves reading the trends movement of the crypto asset, prediction of assets future prices in order to make profitable period to go into and leave trades. With technical indicators, it offers investors quite a reliable way to profitably earn since the trends and price movements is being signaled to them by these technical indicators illustrated with a graphical chart. Example ; showing ADX and KDJ indicators added to steem/BTC chart.
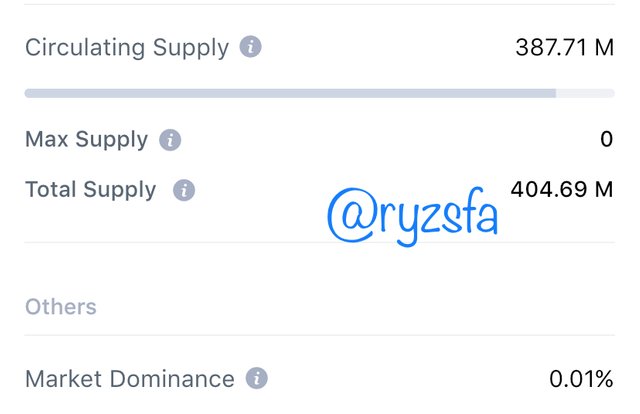
These technical indicators with the help of past data of the asset such as ;for instance steem,
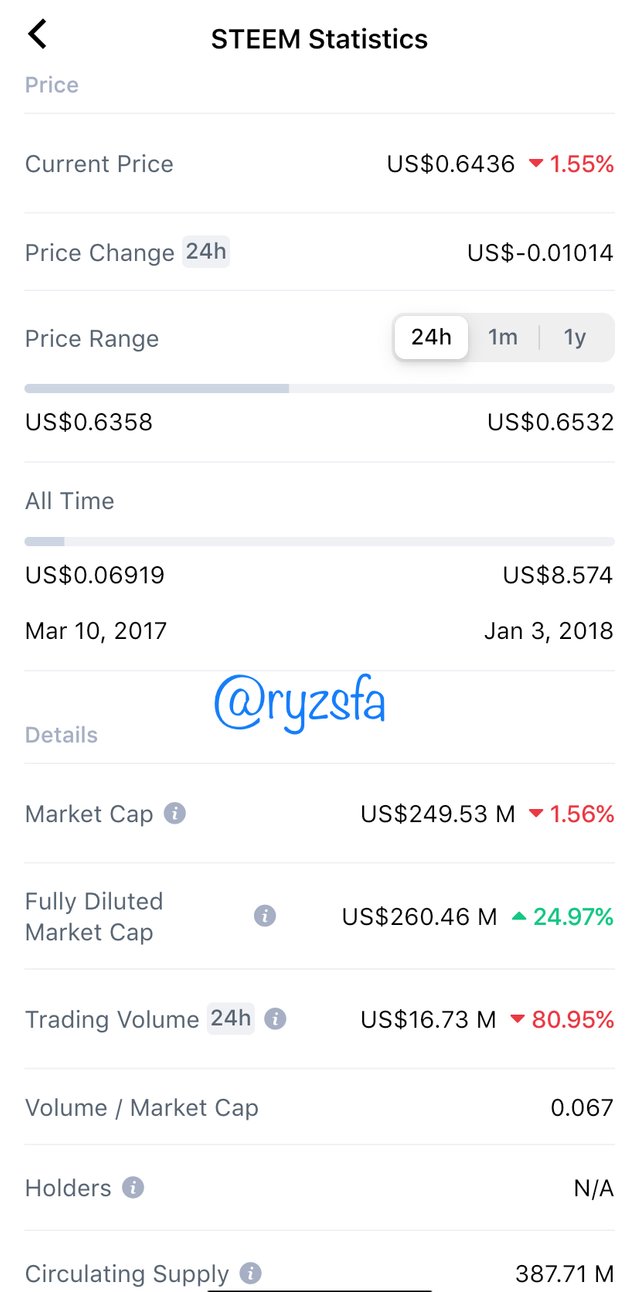
These statistics from the asset aids these indicators in making technical analysis of the asset which however is being utilized profitably by investors.
why is it a good technical analysis tool.
First of all , I will say it’s because it functions maximizes profit. Investors would testify to the fact that technical indicators are the supreme tools service renders which maximize profit. They are very reliable when being used to make technical analysis of a crypto asset. This is so because they offer quite a concrete predictions of price movements and trends which aids investors a lot. Moreover, when predictions are made , it serves as a signal to traders or investors after being confirmed with several technical indicators.
b) Are technical indicators good for cryptocurrency analysis? Explain your answer.
Per my opinion I strongly believe and say that technical indicators good for cryptocurrency analysis although I’m not a good user of these indicators. This I choose is all because technical indicators are very key in the analysis of a cryptocurrency. This is because it provides all the necessary information required in the analysis of a crypto asset. Such as , with technical indicators price movements and trends are being signaled which aids investors in making decisions as to which asset and when to enter into trade since the market trends are clear. Considering the work of technical indicators which uses previous data statistics to predict the market trends serves good for analysis of cryptocurrencies.
c)Illustrate how to add indicators on the chart and also how to configure them. (Screenshot needed).
To add an indicator to a chart, kindly follow my steps illustrated below. Here I will be using TradingView to make my illustrations.
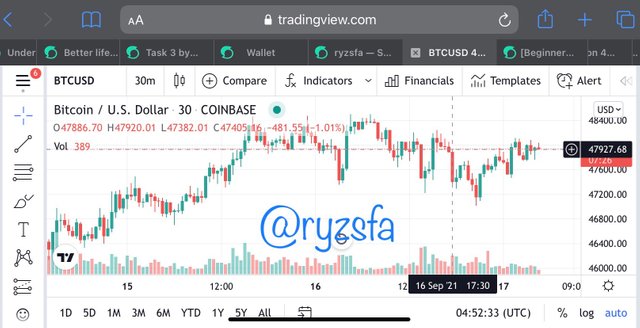
- step 1
Commence by visiting TradingView.com.
Choose a pair you want to add your indicators to its chart. Here I chose BTCUSD pair
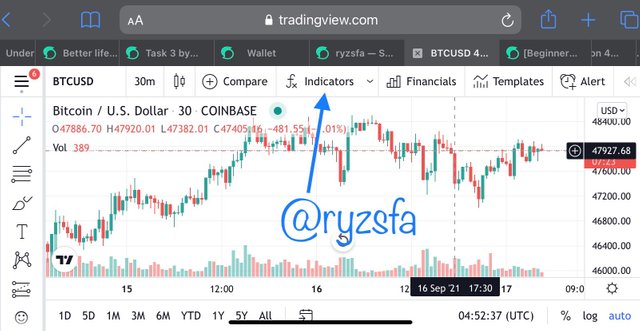
- step 2
Indicated by the arrow is the indicators option, tap on it to select the indicator you wish to add.
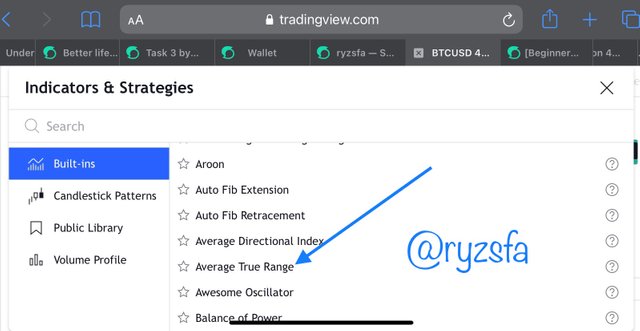
- step 3
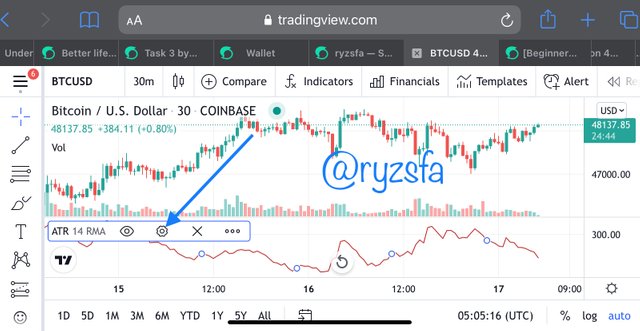
Here I choose ATR as the indicator I wish to add to the chart. Tap on it and automatically it will be added to the chart.
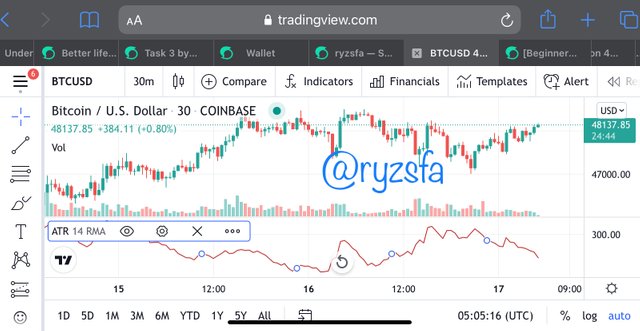
how to configure the indicator
The ATR has a very simple configuration form since it involves just one oscillating line.
First of all visit the settings option for the ATR indicator shown by the arrow.
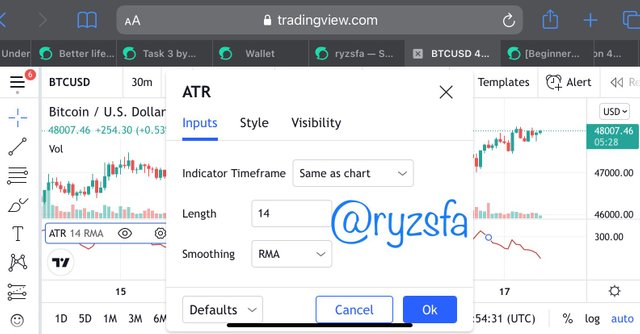
It consists of three main forms of formatting which are inputs, style and visibility
Inputs
This is where our length of the ATR indicator is edited.
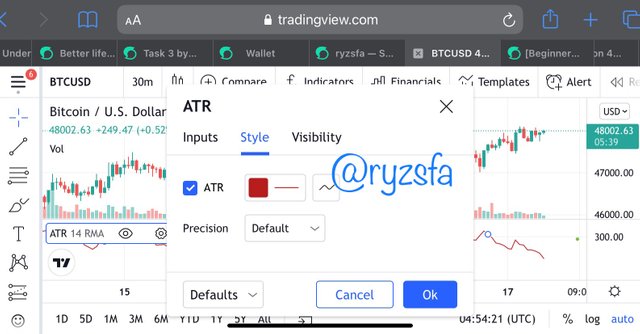
Style
Here is available for editing its display in terms of colour change, shape etc to your preference.
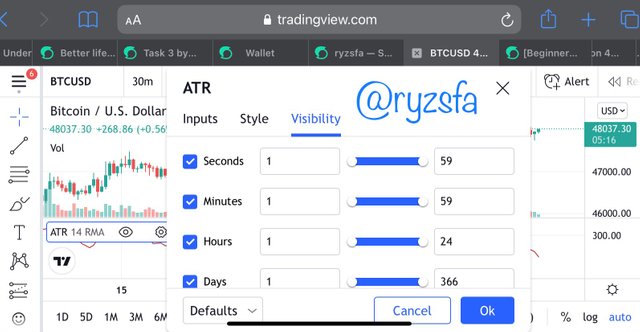
Visibility
This is normally better at default I recommend it too. Although you can make your own changes to suit your preference.
2a) Explain the different categories of Technical indicators and give an example of each category. Also, show the indicators used as an example on your chart. (Screenshot needed).
The categories of Technical indicators are;
Trend-base indicator
volatility-base indicator
momentum-base indicator
Below are the explanations for the categories of Technical indicators.
Trend-base indicator
These type of indicators basically are known to reveal the market trends. It shows whether the market is having a bullish or a bearish trend which plays a very judicious role to investors. However it also tells the strength at which the trend is moving.
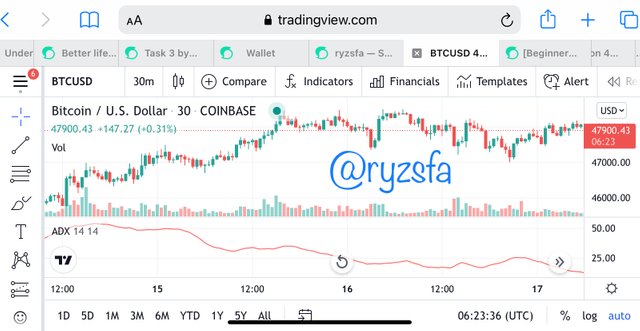
Example of the Trend-base indicator is the Average Directional index(ADX)
Here is a representation of ADX on a chart of BTCUSD on TradingView.com.
volatility-base indicator
This type of indicators is are technical analysis tools designed to calculate the range at which the price level of a crypto asset falls or rises during a specific time interval. This strongly aids investors to make profitable trades by knowing when to enter into trade and leave since the price range is being signaled.
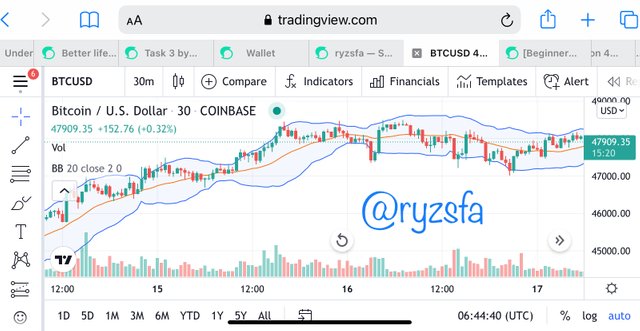
Example of the volatility-base indicator is the Bollinger Bands(BB).
Below is a representation of BB on a chart of BTCUSD on TradingView.com.
momentum-base indicator
momentum-base indicators are equally technical analysis tools which is used to tell the rate at which the price of a crypto asset falls or rises as well as display its price movement nature. This includes its strength, whether there is an uptrend or downtrend in price. Moreover this type of indicators is fairly equal to other indicators. This is because it helps expert traders to maximize profit since it signals them when there is an oversold or an overbought market which is very useful to traders.
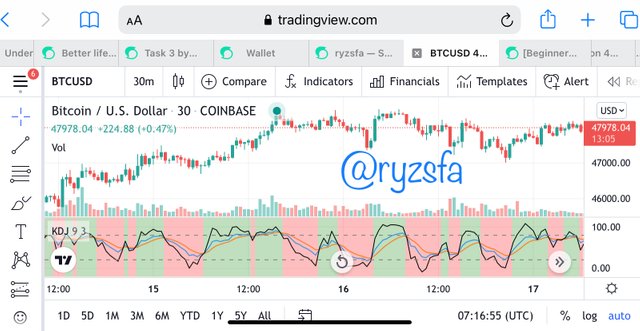
Example of the momentum-base indicator is the KDJ indicator.
Below is a representation of the KDJ indicator on a chart of BTCUSD on TradingView.com.
b)Briefly explain the reason why indicators are not advisable to be used as a standalone tool for technical analysis.
It is advisable not to use indicators as a standalone tool for making technical analysis because sometimes the indicators give inaccurate records and predictions. This however mostly cause unbearable inconvenience thus a loss to traders who only relied on that single indicator to enter into a trade. Indicaters are quite reliable anyway but necessarily it most advisable to use more than one indicator to confirm a trend before entering into trade. Indicators solely isn’t very reliable because they are predictions and predictions aren’t accurate. So two or more indicators are rather used to increase the accuracy of a trend.
C)Explain how an investor can increase the success rate of a technical indicator signal.
As mentioned earlier, indicators should be used hand in hand to confirm trend signals. Two or more indicators used to predict a trend has a very high accuracy level which makes is reliable to use to enter into trade or leave.
Conclusion
This is a very interesting topic which was very well explained by our noble professor @reminiscence01. I really enjoyed your class thanks to your incredible explanations.
Hello @ryzsfa, I’m glad you participated in the 2nd week Season 4 of the Beginner’s class at the Steemit Crypto Academy. Your grades in this task are as follows:
Recommendation / Feedback:
Thank you for submitting your homework task.
Thanks for the feedback prof.