Steemit Crypto Academy Contest / S14W5 : Exploring STEEM/USDT Trading
 |
|---|
INTRODUCTION |
Seasons greetings everyone, our engagement challenge topic this week is exploring STEEM/USDT, were we get to learn about the tools traders uses to analyze the STEEM/USDT market and other financial markets.
 |
|---|
Like farmers, financial market traders needs to know and learn this tools, to help them maximize their profits. Hence, this week's topic is all about getting a grasp of this analysis tools.
Using the MACD, how can you identify a buy or sell signal for the STEEM/USDT pair? And what do the upper band and lower band in the Bollinger Bands for the STEEM/USDT pair indicate? |
|---|
MACD is an analysis tool used by traders to help them analyze the price movements of assets, in our case is the cryptocurrency market as we look into the STEEM/USDT pair.
MACD which stands for Moving Average Convergence Divergence is used to analyze the difference between two moving averages of an asset's price over a specific period, in other to help us identify possible trends and improve our decision making on whether to buy or sell the asset.
Therefore MACD indicator determines the likely market trend by comparing two different moving averages of an asset, looking into how the moving averages come together (convergence) or spread out (divergence) from each other.
MACD indicator uses two different time frame moving averages, a short-term moving average (the Signal line) and a long-term moving average (the MACD line).
Therefore, when the short-term moving average intersects and crosses above the long-term, it indicates a bullish trend, implying an upward trend is expected, hence giving traders a sign to buy, and when the short-term moving average intersects and crosses below the long-term moving average, it suggests a bearish trend, indicating a downward trend is expected, thereby giving traders the sign to sell.
This is what traders use to make trading decisions about buying or selling assets when using the MACD indicator to identify possible changes in the direction of price movements of an asset.
For us to identify a buy or sell signal on the STEEM/USDT chart, we have to apply the MACD indicator to the chart, I will be using Tradeview to help me identify the signals, hence to apply MACD to the STEEM/USDT chart, follow the steps below:
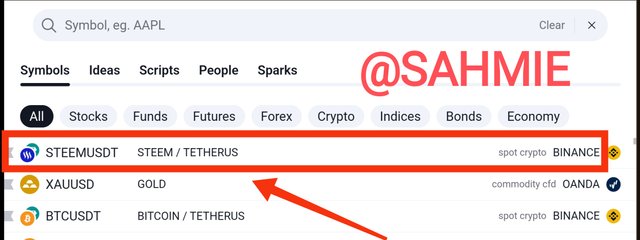
Step 1: Open the Tradeview platform and search for the STEEM/USDT trading pair.
 |
|---|
 |
|---|
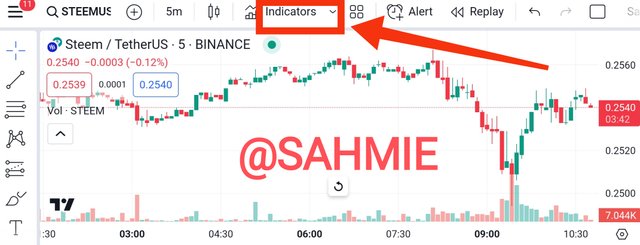
Step 2: Once you have the chart on display, then locate and click on the "Indicators" button, usually located near the top of the chart.
 |
|---|
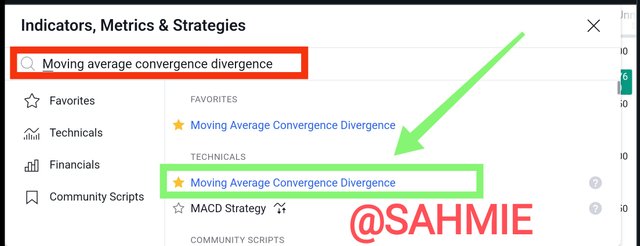
Step 3: In the search bar, search for "Moving Average Convergence Divergence" and select it from the list.
 |
|---|
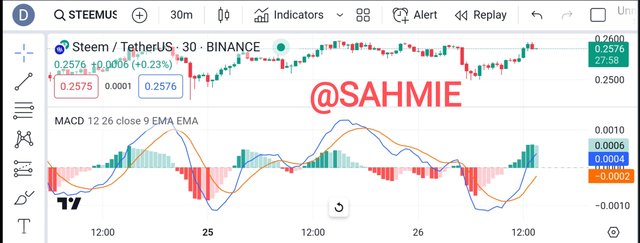
Step 4: The MACD indicator will be displayed on the chart, showing the MACD line, signal line, and histogram.
 |
|---|
Note:
- The short-term moving average is the MACD line (the Blue Line) from the above screenshot. While
- The long-term moving average is the Signal line (the Gold Line) from the above screenshot.
In the screenshot above, I have the MACD indicator added to my chart, I can now check for crossovers between the MACD line and the signal line to identify potential buy or sell signals on Steem. For the potential buy or sell signals points, look at the screenshot below.
 |
|---|
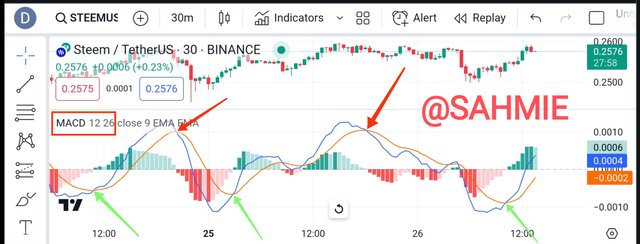
From the screenshot above, we have the Red arrows pointed at the points where the MACD line is crossing below the Signal line, indicating our potential sell points, while the Green arrows at the points where the MACD line is crossing above the Signal line indicting our potential buy points. We also have the histogram showing the peeks and throughs of the upward and downward trends respective.
Bollinger Bands like MACD, are analysis tools that are used by traders to help understand the price movement of an asset. The Bollinger Bands consists of three lines;
The UPPER AND LOWER bands, which are based on the volatility of the asset price, and
The MIDDLE LINE, which indicates the simple moving average.
When using the Bollinger Bands, if the price of an asset is in the middle of the bands, that is, closer to the simple moving average line, it is said to be that the asset is stable, but when the price starts touching or crossing any of the upper or lower bands, it means that the asset is getting exciting, indicating likely overbought or oversold conditions.
When the price starts touching or crossing over the upper band, it means that the asset is being overbought and that the price could drop, telling traders to sell, and when the price is crossing or touching the lower line, it means that the asset is being oversold, meaning that the price may go up, so encouraging traders to buy.
Now, relating it to the STEEM/USDT chart to get their indications, we have to apply it to the chart, to do that, follow the steps below;
Step 1: Since we have already opened the STEEM/USDT chart before, just click on the "indicators" again at the top.
|
|---|
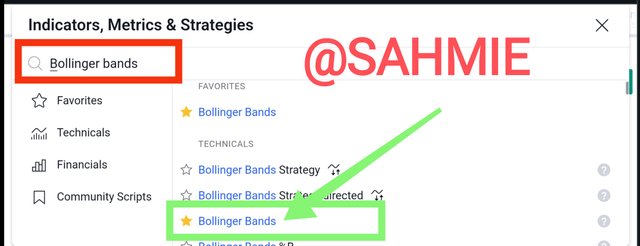
Step 2: Search for "Bollinger Bands" and select it to apply them to the chart.
 |
|---|
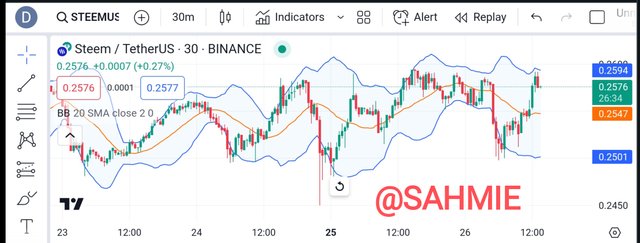
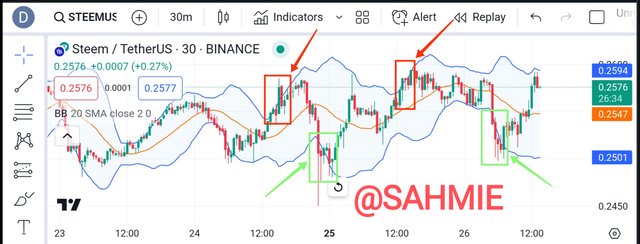
Step 3: The Bollinger Bands indicator will be displayed on the chart, showing the upper and lower bands, and the middle line as shown by the screenshot below.
 |
|---|
Using the screenshot above, I have indicated how to use the upper band and lower band in the Bollinger Bands for the STEEM/USDT pair indicate.
 |
|---|
Now we can see from the above screenshot where the price is touching or crossing over the upper band (RED arrows) indicating a potential deep in price, and the price touching or crossing the lower band (GREEN arrows) indicating a potential rise in price.
How can the combination of RSI and moving average help determine entry and exit points for STEEM/USDT? And how could a trader use the Stochastic Oscillator to confirm bullish or bearish trends in the STEEM/USDT pair? |
|---|
RSI which stands for Relative Strength Index is another indicator just like the MACD indicator that enables traders to figure out if an asset has been overbought or oversold by looking at the recent price movements and comparing how much the asset gained (went up) against how much it lost (went down).
Thus, if the RSI value of an asset pair is high, it means that the asset is being overbought and expects a possible pullback, and if the RSI value is low, it means that the asset is being oversold and could bounce back soon.
When the RSI value is close to 70 and above, it means the asset is being overbought and traders should expect a price drop or a pause. While, when the RSI value is close to 30 and below, it means the asset is being oversold, and it might be time for a price increase or a bounce back.
However, the RSI is usually plotted along with the Moving Average, where the Moving Average is just the average in the price of an asset over a period calculated by taking the average of the closing prices of the asset over a period and it is used by traders to get a sense of the overall trend.
The RSI shows us how strong the price is and if it's going to go up or down using its low and high values to determine buy or sell positions respectively, and the moving average shows us the average price of an asset over a certain period.
Where, when the price is above the average, it means the trend is going up, and it's a good time to buy, and when the price is below the average, it means the trend is going down, and it's a good time to sell.
By combining both the RSI and moving average, we can get a better sense of when to buy or sell an asset based on the strength of the price and the overall trend.
When we use the RSI and MA lines to predict our entry and exit points, in this case, if the RSI line is close to or above the 70 mark, it implies that the asset is being overbought, and if the RSI line is close to or below the 30 mark, it indicates that the asset is being oversold.
Now, to use these indicators on STEEM/USDT to determine entry and exit points, I will apply both indicators to our chart using the Tradeview platform, to do that follow the steps below;
Step 1: Since we have already opened the STEEM/USDT chart before, click on the "indicators" again at the top.
|
|---|
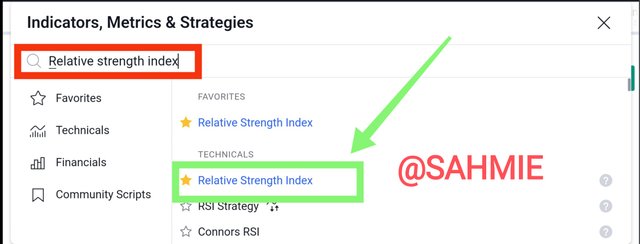
Step 2: Search for the RSI indicator and click on it to add it to the chart.
 |
|---|
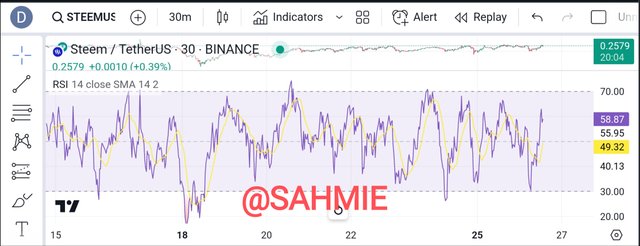
Step 3: The RSI and the Moving Average lines will now be added to our chart, providing us with insights into potential trends and entry/exit points.
 |
|---|
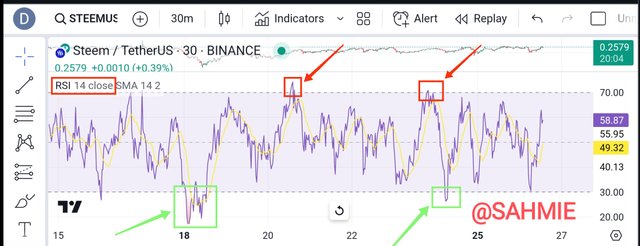
From the screenshot above, we can now look for potential trends and entry/exit points for the STEEM/USDT pair by looking at the points where the price is touching of below the 20 mark for entry points and where the price is touching or above the 70 mark for exit points. Therefore, from the above screenshot we have;
 |
|---|
Where the points at which the price is touching or below the 20 mark (Green arrows) shows our entry points, and the points where the price is touching or above the 70 mark (Red arrows) shows our exit points.
The Stochastic Oscillator is yet another technical analysis tool that helps traders understand if an asset is being overbought or oversold, indicating if the price has gone too high or too low compared to its recent price records (moving average).
When using the Stochastic Oscillator if the price of the asset goes above the 80 mark, it means that the asset is being overbought, hence traders should expect a drop, meaning it could be a good time to sell, exit the market, or take profits.
Whereas, when the Stochastic Oscillator goes below the 20 mark, it means that the asset is being oversold and traders should expect a bounce back, meaning it could be a good time to buy or enter a position.
Therefore, with the Stochastic Oscillator traders can spot the possible turning points in the price of an asset and find the right time to make a trade.
Hence, we can use the Stochastic Oscillator to confirm bullish or bearish trends in the STEEM/USDT pair in the following ways.
Once applied to the STEEM/USDT chart, and the Stochastic Oscillator line crosses below the 20 mark (the oversold level) it could be a signal that the price might start going up, indicating a potential bullish trend, and a good time for us to consider buying or holding onto our STEEM.
Whereas, if the Stochastic Oscillator line crosses above the 80 mark (the overbought level), it could be a sign that the price might start going down, suggesting a potential bearish trend, making it a good time for us to consider selling or taking profits on STEEM.
Now let us use the Stochastic Oscillator on STEEM/USDT, to apply the Stochastic Oscillator, follow the steps below;
Step 1: Since we have already opened the STEEM/USDT chart before, click on the "indicators" again at the top.
|
|---|
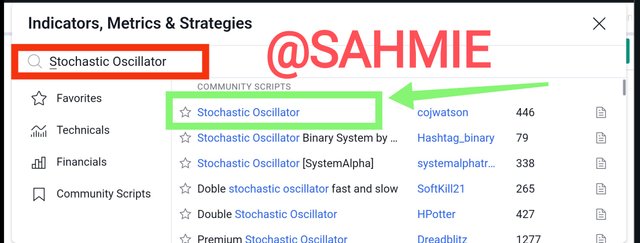
Step 2: Search for "Stochastic Oscillator" and select it to apply on the chart.
 |
|---|
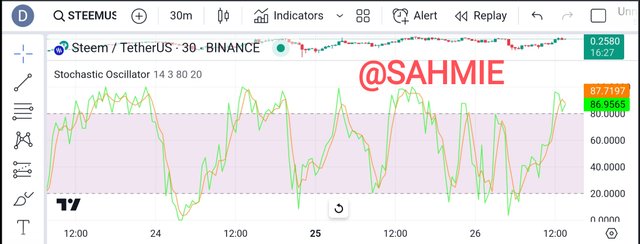
Step 3: The Stochastic Oscillator will be plotted on the chart, usually as two lines, the Oscillator line and the Moving Average line.
 |
|---|
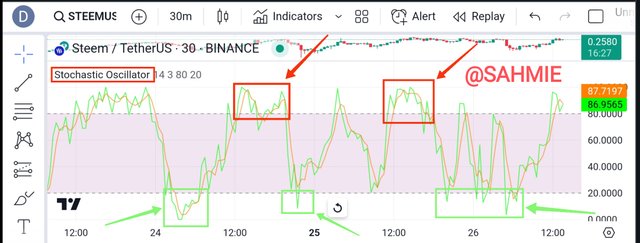
From the screenshot above, we can now confirm potential bullish or bearish trends in the STEEM/USDT pair by looking at the points where the price is touching of below the 30 mark for Bullish trend and where the price is touching or above the 80 mark for Bearish trends. Therefore, from the above screenshot we have;
 |
|---|
Looking at the screenshot above, where the price is touching or below the 30 mark (Green arrows) indicates potential Bullish trend, and the points where the price is touching or above the 80 mark (Red arrows) shows potential Bearish trend.
How important is a stop-loss when trading STEEM/USDT, and how can it be set based on technical analysis? Why is it essential to diversify positions when trading the STEEM/USDT pair? |
|---|
The Stop-loss order is a very important risk management tool for traders in the financial market even when trading cryptocurrencies like STEEM/USDT.
A Stop-loss is a command traders give to close a trading position when the price of an asset comes to the level specified by the trader. It is used by traders to limit their potential loss from a trading position or as a shield for traders from falling into significant market movements against them.
When trading the STEEM/USDT pair we can set a stop-loss order based on our desired support level when we use our analysis tools. Then, how can we apply Stop-loss on our STEEM/USDT pair? To show that, I will be using the Binance exchange platform to show the step-by-step guide.
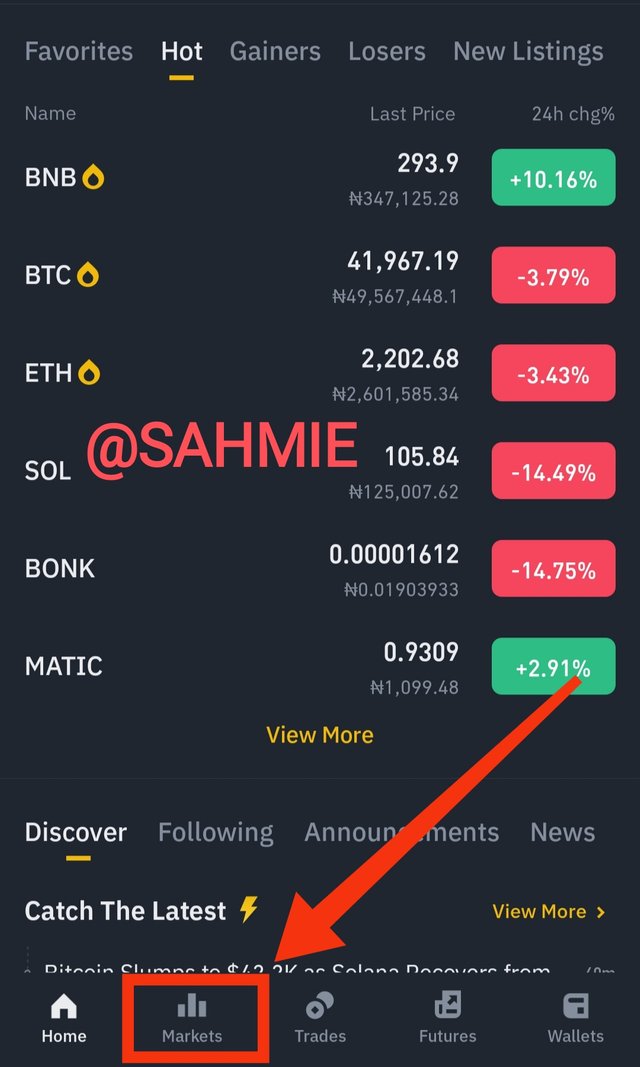
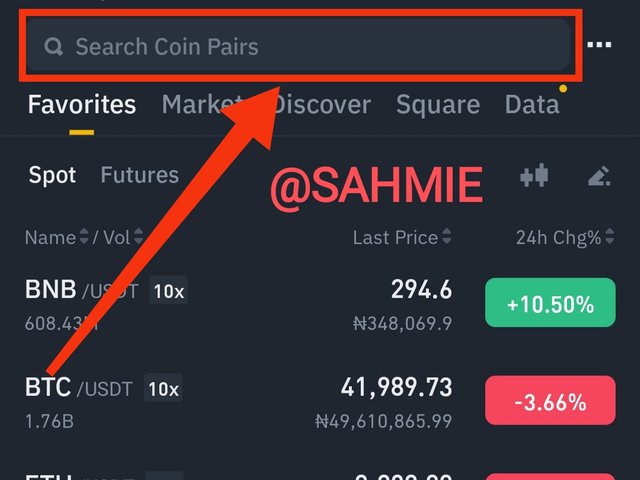
Step 1: Open the Binance Exchange Pro version and click the "Markets" button, second left on the bottom row.
 |
|---|
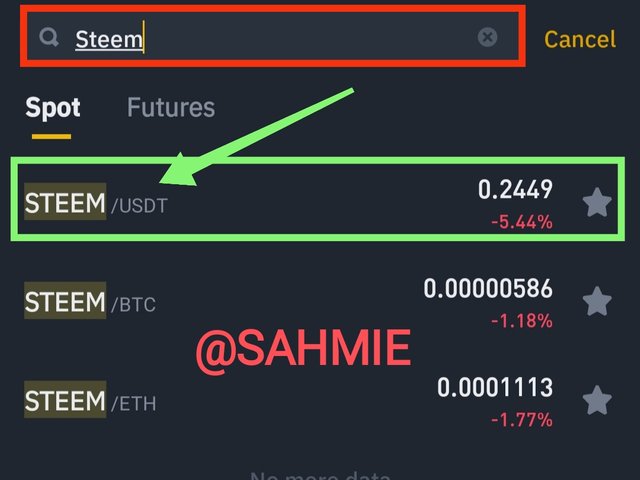
Step 2: In the search box on top, search for the STEEM/USDT pair and select it.
 |  |
|---|
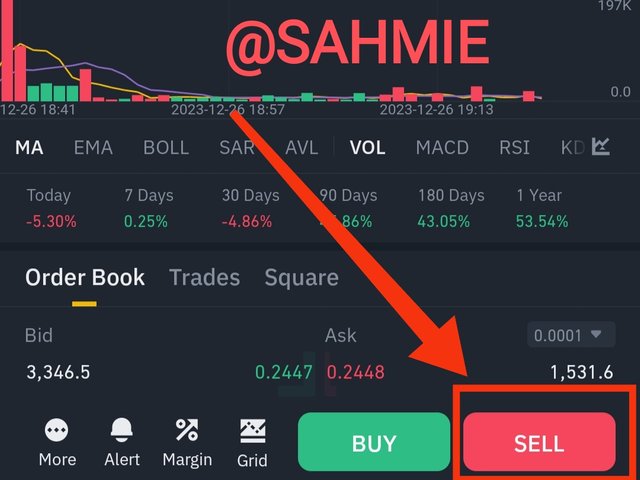
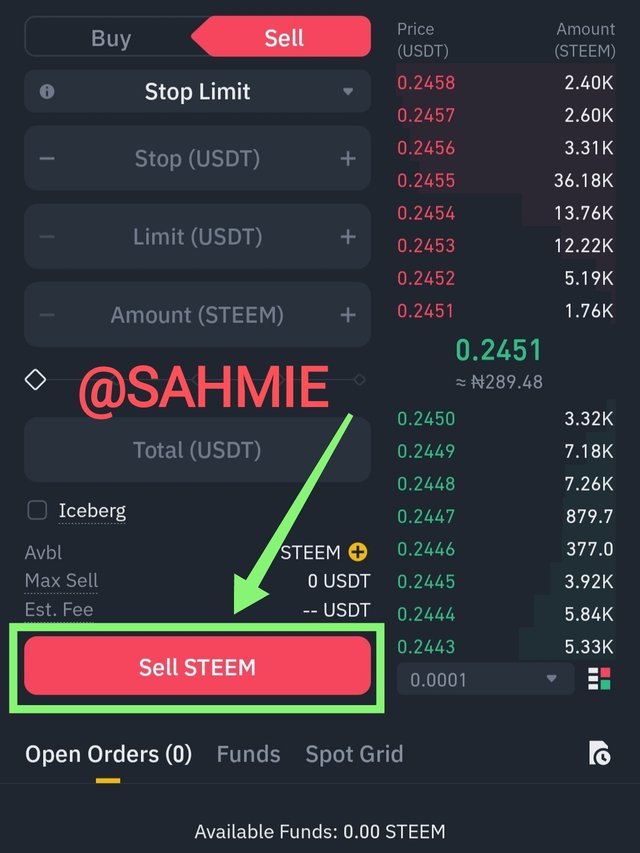
Step 3: Click on "Sell" at the bottom right corner to open the Trade window.
 |
|---|
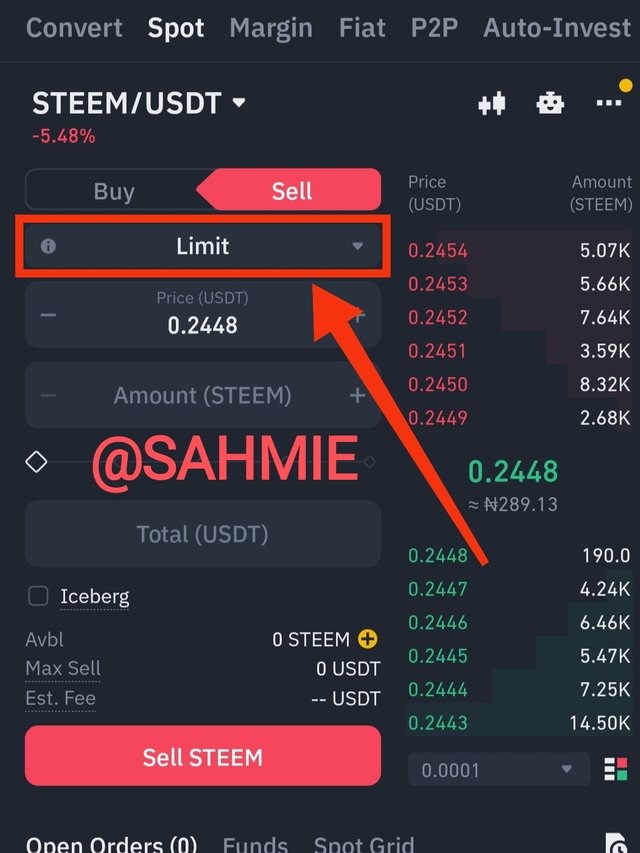
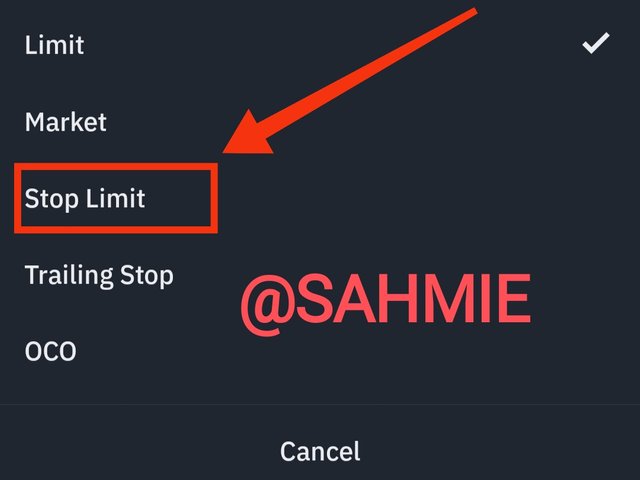
Step 4: On the trade window, click on the "Limit" option and change it to "Stop-Limit".
 |
|---|
 |
|---|
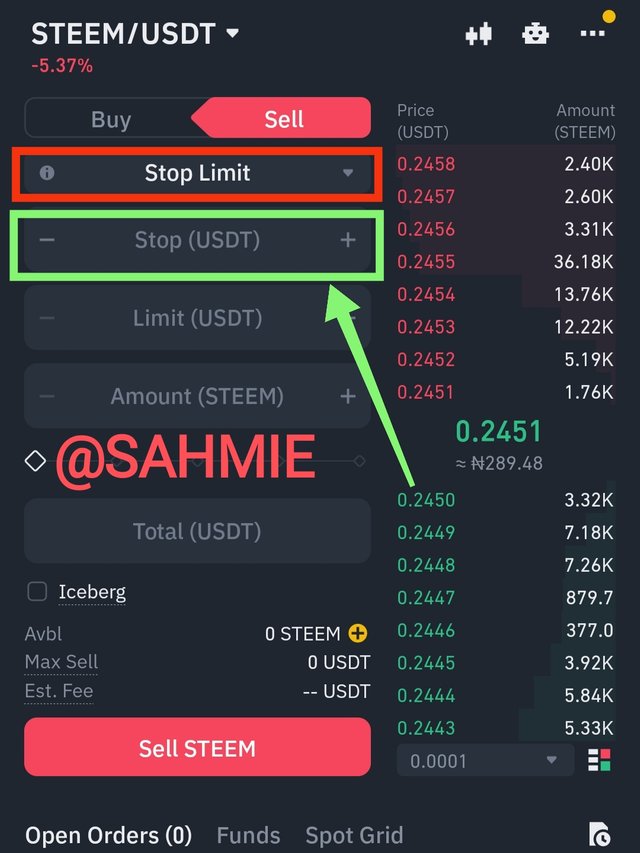
Step 5: Enter your desired stop price. That is, the price at which you want the stop loss to be triggered.
 |
|---|
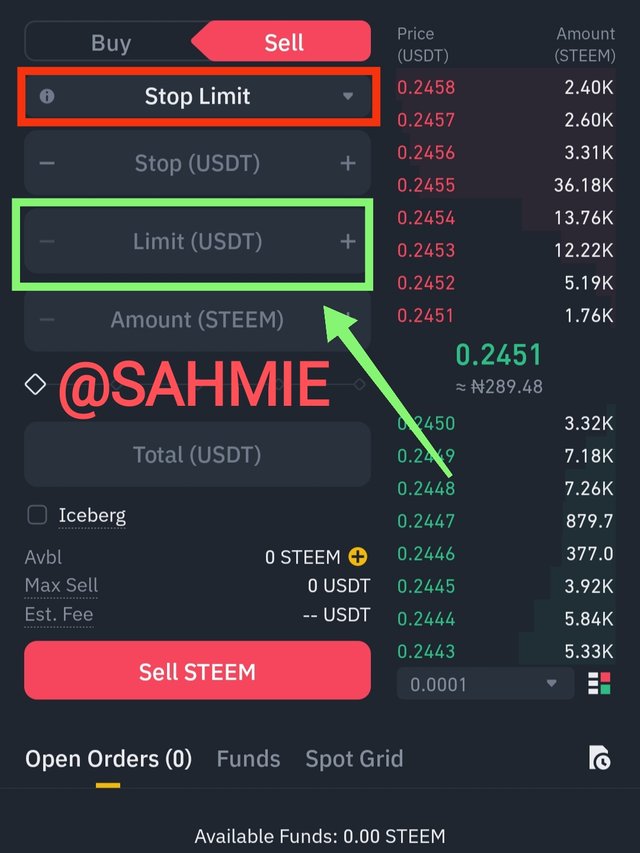
Step 6: Enter your limit price. (the price where the stop-loss order will be executed after the stop-loss is triggered).
 |
|---|
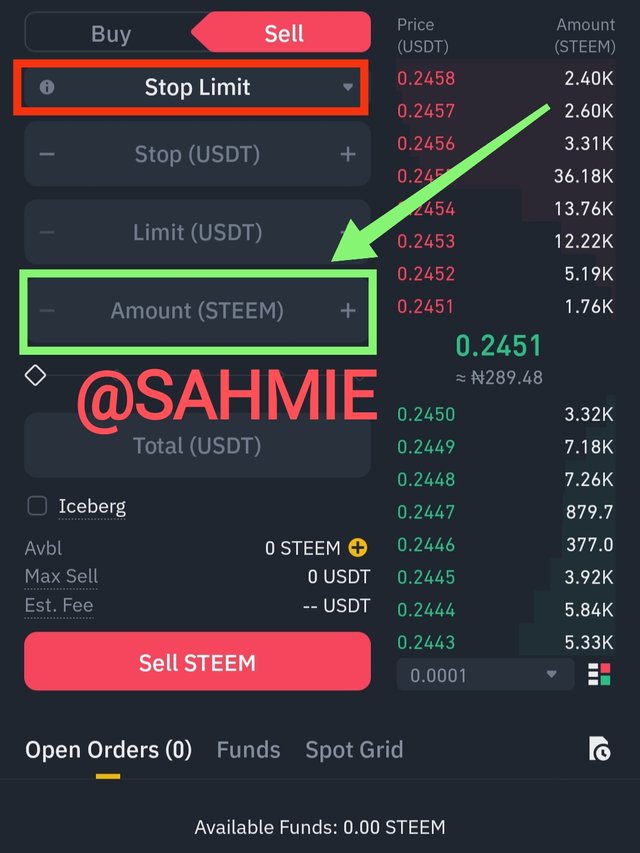
Step 7: In the amount space, enter the amount of STEEM you desire to sell when the stop-loss is triggered.
 |
|---|
Step 8: Click the "Sell Steem" button to place your stop-loss order.
 |
|---|
Diversifying our positions means spreading our investment over different assets or markets to reduce our loss risk. It's all about not having all our eggs in one basket. Thus, by investing across different assets, we can potentially earn profits from more than one source and lower the effect of volatility from trading just one asset.
 |
|---|
Therefore we must diversify our positions when trading STEEM/USDT by trading other cryptocurrency pairs.
What fundamental factors should one consider before taking a long or short position in STEEM/USDT? and how can external events, such as announcements related to STEEM or stablecoins, influence the trading of the STEEM/USDT pair? |
|---|
When considering to take a long or short position in the STEEM/USDT market, we have to consider the following factors;
Development and adoption of STEEM:
Before taking a position in any STEEM-paired market, we have to check for updates about the development of the STEEM blockchain and STEEM adoption as the more STEEM is being adopted across different sectors and markets, the more people will demand STEEM, which will lead to increase in STEEM price and vice versa.
Market Sentiment:
Market sentiment is another factor we must consider before taking positions in the STEEM/USDT market. This means that we have to watch the overall market sentiment towards STEEM and cryptocurrencies at large for changes as any change in the overall market sentiment can also affect the price of STEEM/USDT.
Regulations:
This means keeping our eyes on changes in the regulations around STEEM and other cryptocurrencies because any change in regulations can affect the demand and adoption of STEEM which may lead to an increase or decrease in the price of STEEM.
Economic Events
Economic events like inflation, interest rates, and geopolitical events, can also affect the demand for cryptocurrencies.
Analyzing all the above-mentioned factors makes up what we know as FUNDAMENTAL ANALYSIS.
how can external events, such as announcements related to STEEM or stablecoins, influence the trading of the STEEM/USDT pair?
External events, such as announcements related to STEEM or stablecoins, can also affect the trading of the STEEM/USDT pair because USDT is a stablecoin in the STEEM/USDT pair. Therefore, examples of announcements that may affect the trading of the STEEM/USDT pair include;
News on STEEM Updates
Any announcement related to the development or update of the STEEM blockchain and its adoption will affect the demand and price of STEEM, where positive news can lead to an increase in price, and negative news can cause a price decrease.
Stablecoin News
Since USDT in the STEEM/USDT pair is a Stablecoin, any crucial news or market changes about stablecoins can affect the demand for USDT and the trading of the STEEM/USDT pair.
Also, announcements related to the cryptocurrency market in general can affect the trading of the STEEM/USDT pair. A good example will be the news about Bitcoin halving causing an increase in the overall market sentiment, which may rub off on other cryptocurrencies like STEEM and USDT.
Apart from commonly used indicators, what other leading indicator could be useful to analyze the behavior of the STEEM/USDT pair? and how can trading volume be interpreted to predict future movements of STEEM/USDT? |
|---|
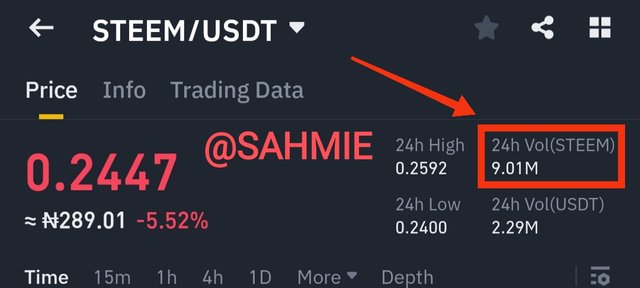
Besides the common leading indicators above, another indicator that is useful for analyzing the market behavior of the STEEM/USDT pair is TRADING VOLUME which indicates the total number of shares or tokens being bought and sold within a given period. Therefore, the trading volume of STEEM/USDT can give us a clue about the future movements of the STEEM/USDT pair.
 |
|---|
When the trading volume for the STEEM/USDT pair is high, it suggests that there's a lot of activity and interest in the market. Trading volume also indicates the strength of a trend or potential price movements. So, if we keep our eyes on the trading volume, we can also get an additional viewpoint on the market behavior of the STEEM/USDT pair.
When there is a high trading volume, it indicates that a lot of people are buying and selling STEEM and USDT, meaning that there is strong interest in the STEEM/USDT market which can potentially drive price movements, whereas, a low trading volume means the opposite, meaning there is minimal interest in buying and selling of the STEEM/USDT pair resulting to lower price movement.
However, when there is a high trade volume during a price decrease, it means that there is an increase in selling and a potential downward trend.
CONCLUSION |
In conclusion, having a know of all this various aspect of the STEEM/USDT market can help us make more informed decisions when trading the STEEM/USDT pair and it can also be applied to other cryptocurrency pairs and the financial market at large. Thank you to the organizers of this contest to help us improve our analysis level, indeed I've learnt so much carrying out my research for this week's engagement.
I wish to invite @starrchris, @jaytime5, @chants and @hamzayousafzai.
Thank You for your Time
NOTE: Always have a smile on your face, as you are never fully dressed without one.

Your explanation of the significance of trading volume in the STEEM/USDT pair is spot-on. Indeed, monitoring trading volume provides a valuable additional perspective on market behavior.
Your observation that high trading volume signals strong interest and potential price movements is a crucial point for traders. The influx of buying and selling activities indicates market participation, and this heightened interest often determine significant price shifts
Thank you so much for your encouraging feedback. I am indeed happy that you found my explanation of the significance of trading volume in the STEEM/USDT pair to be spot-on.
Monitoring trading volume can indeed provide valuable insights into market behavior. When there's high trading volume, it usually signals strong interest and potential price movements. The increased buying and selling activities indicate active market participation, and this heightened interest often leads to significant price shifts. Therefore, it is definitely an important analysis tool for traders to consider. Thanks again for your kind words and compliment of the season.
¡Saludos, @sahmie!
Has presentado una entrada increíblemente detallada y educativa para el concurso de la Steemit Crypto Academy sobre "Explorando el trading de STEEM/USDT". Tu explicación sobre cómo utilizar indicadores como MACD, Bollinger Bands, RSI y el Oscilador Estocástico es muy completa y fácil de entender.
Me gusta cómo proporcionas capturas de pantalla paso a paso de cómo aplicar estos indicadores en Tradeview, lo cual es muy útil para aquellos que están aprendiendo sobre el análisis técnico. Además, tu explicación sobre la importancia del stop-loss y la diversificación de posiciones es valiosa para la gestión de riesgos en el trading.
También, tu enfoque en la importancia de factores fundamentales, como el desarrollo y adopción de STEEM, el sentimiento del mercado, las regulaciones y eventos económicos, agrega una dimensión adicional a tu análisis. Además, destacas la importancia de estar al tanto de eventos externos, como anuncios relacionados con STEEM o stablecoins, que pueden influir en el trading.
En resumen, tu entrada es completa y ofrece una guía útil para aquellos que deseen comprender y participar en el trading de STEEM/USDT. ¡Excelente trabajo y mucha suerte en el concurso!
Thank you so much for your kind words. I'm really glad you found my entry comprehensive and useful for those who want to understand and participate in STEEM/USDT trading. It means a lot to me that you think it is an excellent work. I appreciate your support and good luck wishes for the contest. Thanks again and compliment of the season ⛄🎄
Bitcoin will grow in price until the middle of 2024. And it will reach a price of $ 55,000 per coin, after which the correction will begin. But until then, within 5 months, the cryptocurrency market will grow in capitalization and as a result, all cryptocurrencies close to bitcoin will grow in price. This post is to encourage my analytics.
Upvoted. Thank You for sending some of your rewards to @null. It will make Steem stronger.
Your post has been successfully curated by @𝐢𝐫𝐚𝐰𝐚𝐧𝐝𝐞𝐝𝐲 at 35%.
Thanks for setting your post to 25% for @null.
We invite you to continue publishing quality content. In this way you could have the option of being selected in the weekly Top of our curation team.
greeting brother @sahmie Learning about trading tools like MACD and Bollinger Bands. MACD helps identify buy/sell signals, while Bollinger Bands show potential price excitement. RSI and moving averages guide entry/exit points, and Stochastic Oscillator confirms trends. Stop-loss is crucial for risk management in STEEM/USDT trading. Diversifying positions is like planting different crops – it helps manage risks and boosts potential profits....best of luck
Thank you so much for sharing this valuable comment about trading tools. I really appreciate it! Your explanation in about risk management in layman's terms was super helpful. Wishing you all the best in your trading endeavors
Hello sir, thank you for sharing quality post with us. You have discussed the given topic which comprises technical analysis, risk management and others.
I think every trader need to manage his or her risk very well to avoid losses. Nice post from you and good luck to you sir.
Thanks for your kind words and appreciation. I agree with you that managing risk is super important for traders to avoid losses. It's great to see that the post covered technical analysis, risk management, and more it was what the organizer wanted from us I guess. Wishing you good luck too, my friend. You didn't do bad yourself, keep up the awesome work.
@sahmie
You have explained very well how to combine moving averages in STEEM/USDT pair we can clearly see that the 2 indicator tools are clearly agreed upon if Talking about the main point in this, the trader in stop loss trades by doing very little loss means that in this you can save yourself in little loss instead of big loss and better for further improvement. You can take your stand else your activity is awesome always keep commenting with other friends and the main points explained in it are awesome.
Hey brother it's really amazing to see how creative innovative and intelligent you can be very creating crypto related article on steemit, such that awesomeness and determination should be awarded because it takes quality time to create such
Thanks for sharing wishing you success please engage on my entry https://steemit.com/hive-108451/@starrchris/steemit-crypto-academy-contest-s14w5-exploring-steem-usdt-tradingwonderful articles
My brother, I really appreciate your kind words and support. It means a lot to me that you find my crypto-related articles on Steemit creative, innovative, and intelligent. It does take a good amount of time and effort to create quality content, but I truly enjoy doing it. Thank you for your well wishes, and I wish you all the success as well. I'll definitely check out your entry and engage with it. Let's keep spreading awesomeness together