Crypto Academy Season 6 Week 3: Support and resistance breakouts for pelon53 by @salemumar5

QUESTION:1
1.- Explain in detail the advantages of locating support and resistance on a chart before trading.
Advantages of using support and resistance
Resistance support are on of the basic terminology used in trading held this technique is used in veery trading platform. If you ain't know these basic information where the pull back and retest of price take though it will be very hard to to grab the trading opportunity in market lets maintain a pros and cons of these resistance and support levels.
These levels usually became the reversal of price action because price always need a backup means to touch that point make a retest or corrections though scalpers play a vital and profitable role in that moment.
Retest and correction:
Now you guys are confused why this retest and correction occur though there is buyers and sellers where they experience oversold and overbought position in market held the momentum also brings new cycle in market and the higher the resistance and support more retest and correction obtained whilst weaker resistance and support bring trend reversal in market.
Demand and supply:
These levels are also responsible by the demand and supply levels in market as you know the universal context higher the demand lower the price and vice versa similarly higher the supply higher the price momentum.
The buying and selling pressure:
These support and resistance oversold and overbought areas in market where traders use to maintain there trades for long and short term both, held these levels having great selling buying pressure and price momentum is so high once the price reach the resistance the sellers pull them back once reached the support the buyers pull them back though a good trading opportunity are extracted we will deeply understand them in our next question.
Trend and strength in market:
These levels are very important to accumulate the strength of market because if the slope is upward while making support by price will achieve you good opportunity similarly in downward trend the downward slope helps the price to react with resistance levels also a consolidation stage where the price became uncertain due to price volatility in this stage these levels helps you to extract opportunity with retest and correction levels.
QUESTION:2
2.- Explain in your own words the breakout of support and resistance, show screenshots for the breakout of a resistance, use another indicator as a filter.
Breakout of support and resistance levels
Breakout of price action always depend upon the support and resistance levels in market. There strength and trend can be very important aspect for trader to move in market flow.
When the price continuously hits the resistance level there will be surely a breakout near although need of other strategies will help you out, whilst the price action hits to support can provide you the selling opportunity in market, these levels are very rare and easy to understand just need a technical understanding of market. When ever the resistance break a bullish cycle will be obatined similarly for downtrend support level should be break to get a bearish cycle.
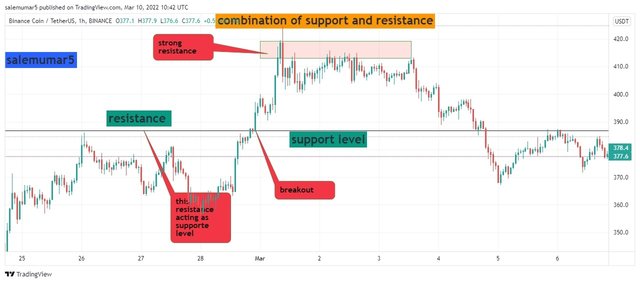
Analysis of support and resistance levels
Here the chart below justified my statements related to support and resistance levels because here you can see the dynamic relationship of support and resistance the combination of these levels state that resistance can be support and support cam be resistance but over here the resistance turn into support where the breaks the resistance levels after hitting many times ultimately the resistance got weaker and the upward breakout has been seen.
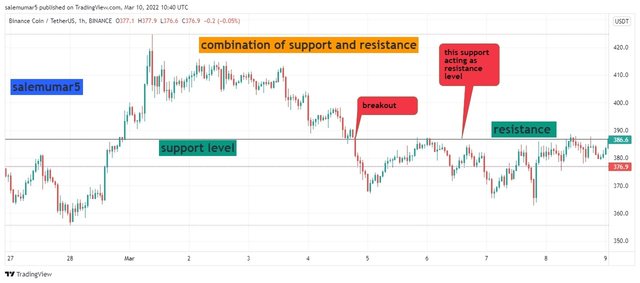
The chart below you can see support breakout strategy while the price hitting the support level continuously and ultimately after some while the support get weaker and weaker found a way in bearish zone with these combination you can see the support level breaks and became resistance.
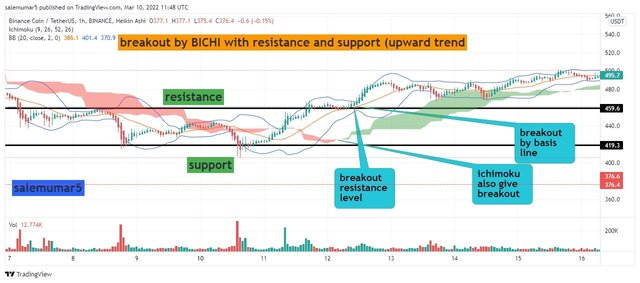
Resistance breakout with additional indicator
Here the chart below is BNB/USDT with 1hr time frame where i am using the bichi strategy along a technical strategy of support and resistance levels. You can see below the the additional indicator making great understanding with this strategy although one more thing i am using hiekin ashi candlestick where the these level easily traceable as you can see below. The price hitting the resistance levels continuously and ultimately broke that level and confirmation of bichi strategy motivated my trading basis line and volume all are in perfect mode and bull run can bee judge.
QUESTION:3
3.- Show and explain support breakout, use additional indicator as filter, show screenshots.
Support breakout with additional indicator
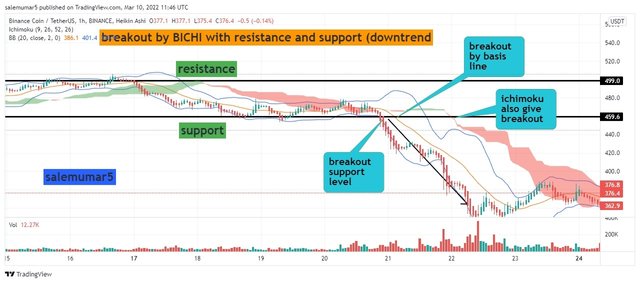
This question deal with support breakout strategy using additional indicator, as you can see the chart below is BNB/USDT with 1hr time frame making Awesome combination with bichi strategy.
The price action hitting the support level and correction is seems to be mean in this trade scalpers can take good opportunity as you can see below heiken ashi making perfect bearish candles and ultimately support level this times get weaker and broken. Though clouds also were in full mode making lower low and basis line also gave breakout as you can see the support level pretend very good combination with bichi volume and hiekin ashi strategy.
QUESTION:4
4.- Explain what a false breakout is and how to avoid trading at that time. Show screenshots.
False breakout and its measure
The breakout scams very rare many trades mostly with future traders, this falseness has been experienced by me as well where you can check my previous week trading contest where my most of the trades were gone false and scam by breakout although i am using many indicator but the volatility hits me very hard and i suffer losses although by using measure to avoid this false breakout. Although these false trade is very rare also in support and resistance level you will see in next chart that all Indicators making breakout position but ultimately a correction waters your trade completely.
These falseness can leads you huge losses and you will liquidate your whole funding, i extract some avoiding things like always maintained your risk reward ratio 1:2 is best don't do greediness it will lead you towards more losses, always ne patient when there is breakout and never judge on indicator.
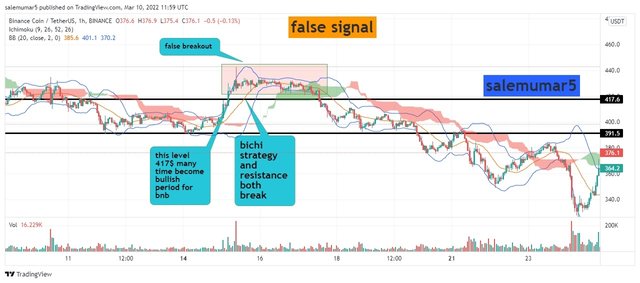
false signal resistance level:
This chart shows you false signal where the resistance level is broken and long position is obtained but if you maintain your risk reward ratio over here you will in profit because you can see how beautifully the market got matched with your means and indicator and your doing dca and other much things but ultimately after few hours you got stuck and getting losses, so here the price means your indicator but not a perfect bullish cycl is ain't come, though wait, risk reward ratio and indicators.
Held i not only discusses the falseness but also provide hand to hand avoiding feedbacks, though look the chart and maintain and ease your trade with fruitful results.
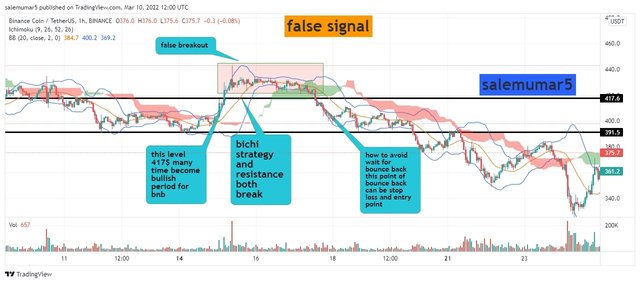
Here below the one more opportunity to avoid this false signals you can;
- 1 Be patient gor perfect bullrun.
- 2 Check the retest which us not held over here so there should be your stop loss.
- 3 Always use multiple Indicators in parralel.
All these strategies help me in my next chart where i easily analysis this short term bullish cycle and scalo minimum profit and get rid of this false signal.
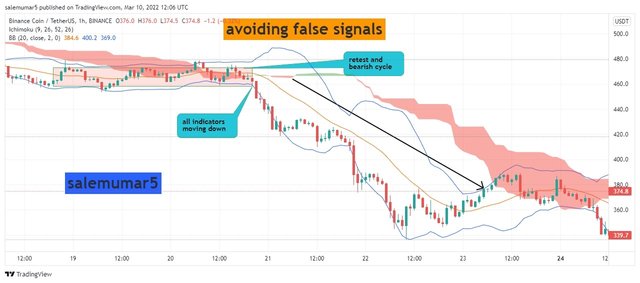
Here in these two charts i try my best to avoid these false signals and checking i am trading or not in false signal, though below I used the retest strategy which is best with support and resistance you can see the price retest the support level and ain't do any consolidation as above but a good short term orofit obtained.
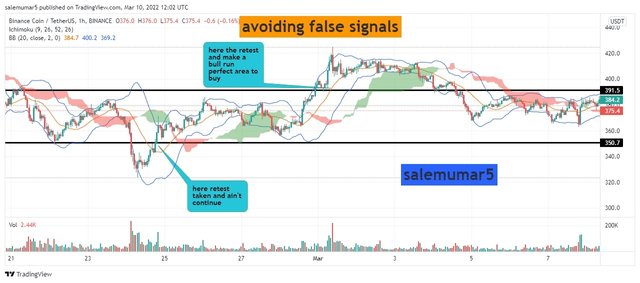
Here below you can see the price retest the resistance level and make bullish cycle though if this retest was not happned. Though this strategy give huge profitable trade you can see with every retest make you 50% take profit and this measure help you very much in your trades.
QUESTION:5
On a demo account, execute a trade when there is a resistance breakout, do your analysis. Screenshots are required.
Demo trade with resistance breakout
Here the chart below is Steem/USDT with 1hr time frame look what i found the strong resistance along my perfect retest has been generated though this trade would definitely put the price upward with the break of resistance level risk reward is 1:3 while the stop los just below the breakout price level and indicator should also be used in parralel as per your means.
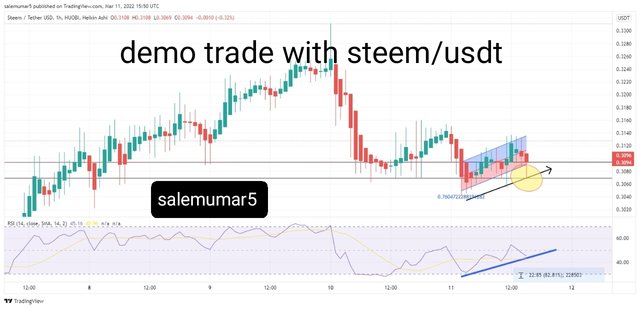
In this STEEMUSDT chart, we did some technical analysis by using the RSI indicator. As we can see that the indicator has just shown an ending of lower trends when we examine the higher-high points just before the line I had drawn in the RSI chart and this indicates that the bearish trend came to an end and now the bullish trend is up to the mark so we can easily mark that side for long term investment like for 2 days or 3 days as the chart you are watching is of 1-hour trading candles which pretty much shows the movement of price in last 2 days which is a downtrend and surely an upper trend is up for a run.
QUESTION:6
6.- In a demo account, execute a trade when there is a support break, do your analysis. Screenshots are required.
Demo trade with support breakout
Here the chart below is BNB/USDT with 1 hr time frame, where you can see the support break analysis with additional indicators. The price level break the support level and i am waiting for the breakout with retest and bichi strategy is also in bearish mode though keep in your mind the btc turning point, because these coins based on btc so btc us in bearish zone though this trade can be opportunate us.
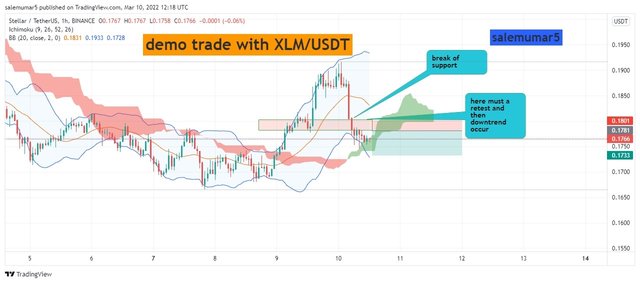
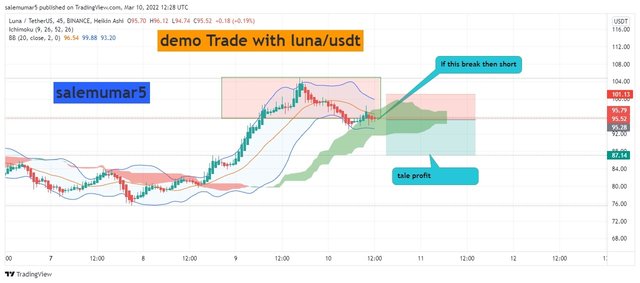
Here you can see the luna,/usdt with 1hr time frame, the price level confirmed the hit of support and trying to break them but here be patient make your trade just below and wait for other indicator to drive the price, and retest of price action towards support level so then take your entry point Risk reward 1:2.
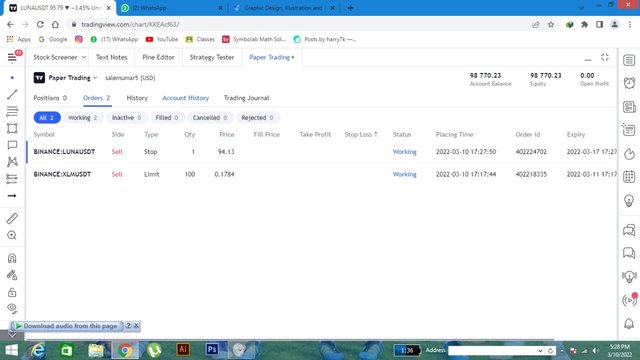
trade history:
Conclusion:
This trading strategy is very important for every trader because they maintain analysis on overbought and oversold position in market which scalpers and other long term traders used and also it will guide you the trend reversal and continuation easily held not necessary for every to read technical indicators rather if they have strong understanding on resistance and support area they can achieve fruitful results.
Held my opinion in trading is same you have to use multiple and strong indicator to trade in this volatile market, professor chooses excellent trading methodology which rewinds and clear our conceptual understanding.
Cc
@pelon53
