Crypto Trading by Identifying Support and Resistance - Steemit Crypto Academy - S6W3 - Homework Post for @shemul21

QUESTION:1
What is the Support & Resistance zone?
Introduction towards Support and Resistance
Resistance and support levels are very important levels, these levels are identified by the overbought and oversold areas in market where these levels formed a strength of buyers and sellers established. The identification of these levels are visualise when price moving upward and certainly give Retest to that level again and again though if this retest ment is consistent though there is strong resistance although if easily broke than weaker resistance similarly when we are talking about support though when price moving downward and makes retest that point continuously though there would be sellers and selling the asset resisting them down and certain level the price again again make these retest ments pretend and examined support level higher the hits and if that level broke this would be weaker support and for strong the price striving to break that level but can't compete that level.
Though these above i provided you the simple and easy resistance and support levels, these levels also means when price moving upward always makes correction toward resistance levels similarly for bearish price makes a retest ment toward support levels so you heard about scalping this is what the scalpers like to trade with these levels in short term.
Lets see the chart below of understanding support and resistance levels;
The chart below you can see the strong resistance level with weak resistance you can see these levels are situated at the top of market structure giving a market good resistance means higher price inertia. Though these levels are established by buyers they buy and buy continuously ultimately pull the market upward where at certain point where retest of price took again and again though a pure resistance means a floor is established.These level are means in two ways one for weaker resistance which you can see first one three hits of price level ultimately broke that resistance level and price making higher high and make another resistance this resistance is very strong because price try to break it many times but ultimately fails and give bearish mode.
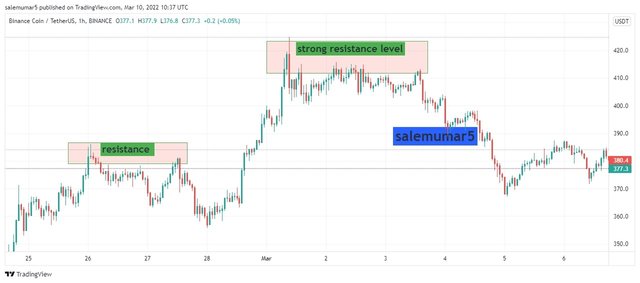
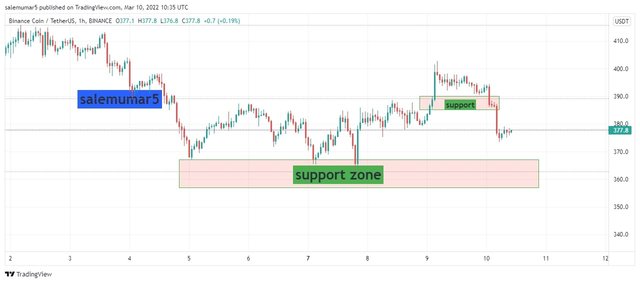
The chart below show us the strong and weaker support levels similarly here this levels is established on the basis sellers which continuously selling the price ultimately an oversold condition met and price make support levels these levels are also known as grounds of price where price makes retest and pull backs. After many try price can't compete the support level but in weaker support price gradually broken after few hits.
QUESTION:2
Explain different types of Support & resistance with proper demonstration.
Explanation of different types of support and resistance
Well we had understand the support and resistance with single method though that was not enough to trade in this volatile market, so there are different types of support and resistance strategies which are very and convenient to understand lets get explore them.
Horizontal Support and Resistance:
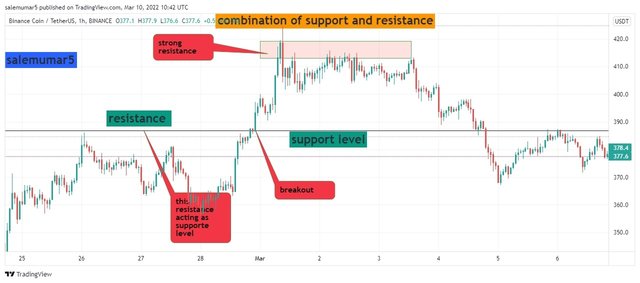
Here the same structure where the support and resistance are pretending to be there partners one broke other got it and prevent one and second became the new one this is little bit complex so as you can see below charts;
Here the support and resistance combination can bee seen upward where the price broke resistance level and resistance became support and you can see the next resistance has been established upward where the price maximum has been achieved and retest also you can see the breakout of upward motion also seem over here.
Here the next chart show us the same combination of resistance and support but this time downward motion has been occured where the support has been broken and became resistance whilst the new level of support has been established at the maximum price retest. Also a breakout has been show where i enlightened with red box ( this support acting as resistance level) thkugh thus also happened here too.
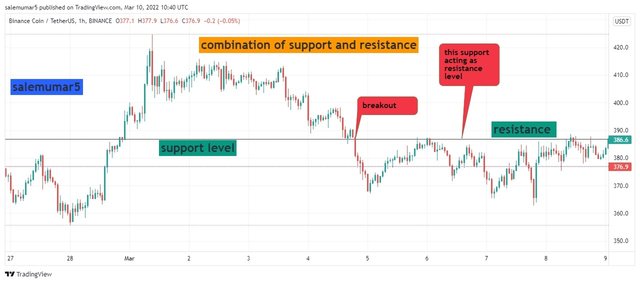
These all levels are based in fundamental and strong volatility in market though you need good understanding to judge the market sentiment.
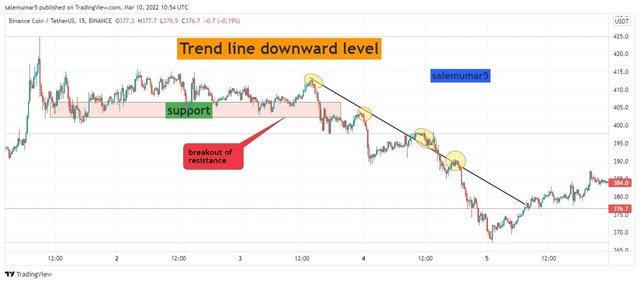
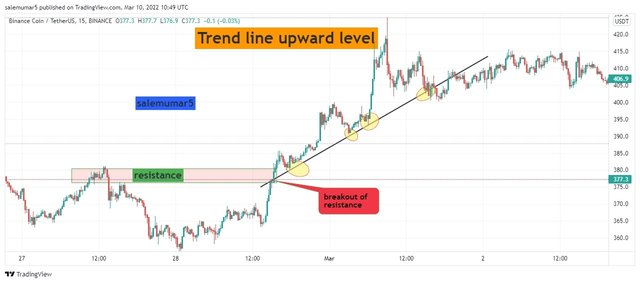
Sloping level:
Here the support level has been broke and you can see the resistance is maintaining the downward motion you can also measure this level by lower lows though for this market making downward correction and moving downward by the help of resistance level slope this slope is called Downward trend of resistance level with the breakout of support level.
Here the resistance level has been broke and you can see the support is maintaining the upward motion you can also measure this level by higher highs though for this market making upward correction and moving in uptrend by the help of support level slope this slope is called upward trend of support level with the breakout of resistance level.
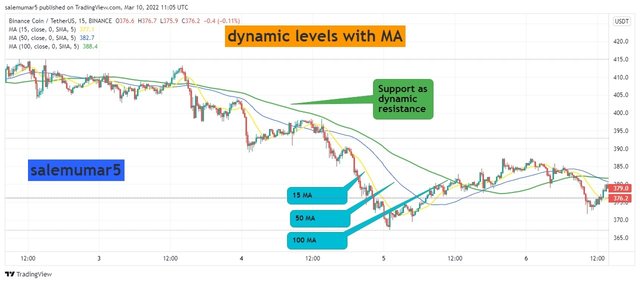
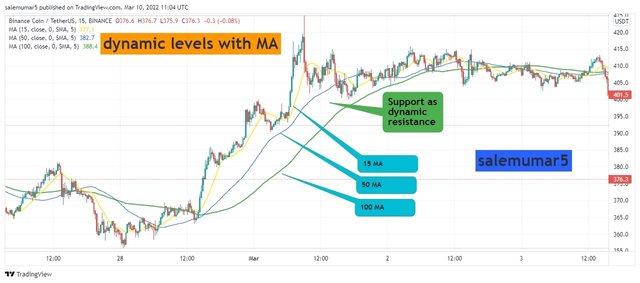
Dynamic level:
These levels are usually helps to identify the trend reversal in market these dynamics support and resistance are very easy and convenient to understand also MA are used to analyse them so we will identify them in charts i will use 15,50 and 100 MA.
Thus chart below you can analysis the you can see support breakout as dynamic resistance levels with different MA and they are resisting the price actions and ultimately making a bearish zone in market, also you need judge these levels in case the MA break you should make stop loss levels but this will happen for long term usually as you can see below
Thus chart below you can analysis the you can see resistance breakout as dynamic support levels with different MA and they are resisting the price actions and ultimately making a bullish zone in market, also you need judge these levels in case the MA break you should make stop loss levels but this will happen for long term usually as you can see below
QUESTION:3
Identify The False & Successful Breakouts. (demonstrate with screenshots)
False and successful breakouts
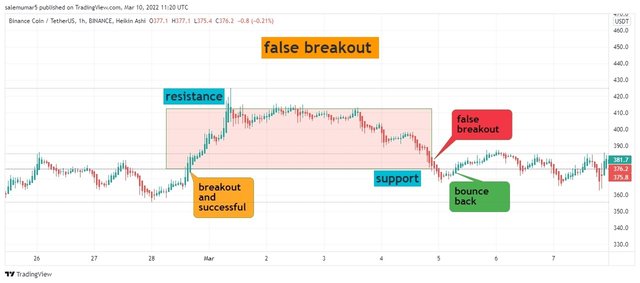
Here the false breakout also the part of resistance and support where traders got liquidate and stuck their trades though these false signals lead them to huge losses because market sometimes ain't following the technical tool yet relying on fundamental and give you false signals though capture your trades and get liquidate you. Best among them are those who wait and watch the market patiently and then enter into trades.
So lets get understand these levels with practical approach held there will be chances of success rate or failure lets do identify them.
Successful and failure these levels are exist when price obeys your technical terms and give you your means trade similarly failure trade is where the market ain't obey you and got you stuck in and move opposite.
failure Breakout:
Here below you are ready to face the falseness because you are sure that market has broken these levels and surely breakout should be there ultimately you make a short position over there you are doing DCA take profit investing more and more but the market change the direction completely and you got fool, to avoid them simply use the below strategy i mentioned;
Always analyse btc first if you are trading in altcoins.
Do enter more technical indicators.
Be patient for perfect breakout out and if the retest obey then take trade.
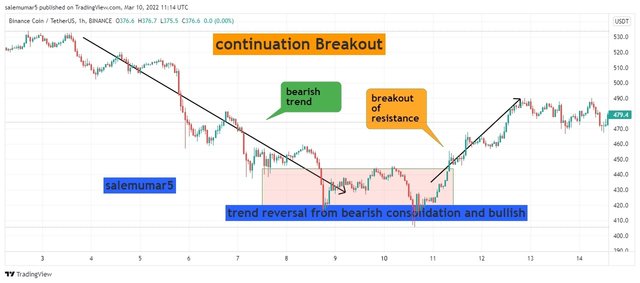
Successful breakouts:
Here some chart below show us the successful breakouts in market wher the price totally ibey the market and i also analysis the three abive mentioned stances btc check, indicator in parralel and patience thkugh you will be tiger trader in market.
Here below the bearish and bullish trend reversal has been observed where the price breaks the resistance level and make hit in support and btc is pumped over here though you can see this reversal was very unique and fruitful too also you ain't need technical indicators if btc is pumped ir you got high fundamental also indictors are important too.
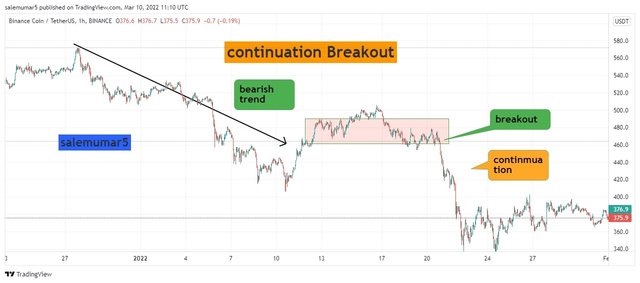
Here below you can see the bearish trenf has been finished and you are ready for trend reversal but if you ain't took measures which i told you you should be liquidate by doing DCA because price ain't go enough up like bearish mode though this would definitely liquidate you. Also a support level also broke and your all strategies gone water with enfing losses in trades.
QUESTION:4
Use Volume and RSI Indicator Combined with Breakouts & Identify the Entry Point. (demonstrate with screenshots).
Breakout with Volume and Rsi for entry points
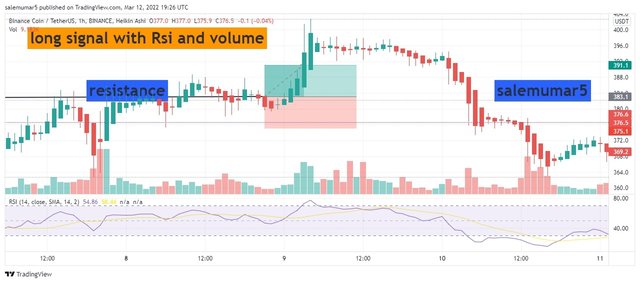
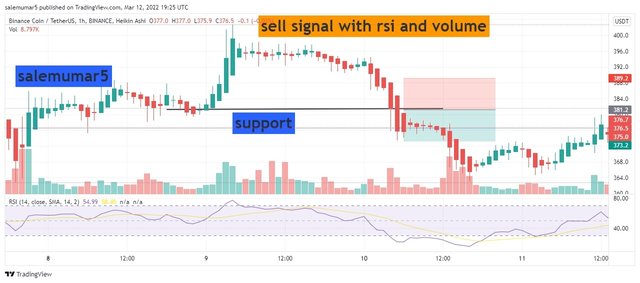
Here you can see the chart below the breakout has been generated by RSI and VOLUME for entry points in market lets analyse each of them in detail.
The chart below is bnb/usdt 1hr time frame where you can see the bull run in market i have spotted the resistance levels are break and you can see the resistance has been broken where you can see also became weaker this first stance to take entry but be patient you can see the th e rsi alos oversold and ultimately you can see the price break the resistance completely and immediately i took entry for long position.
The chart below is bnb/usdt 1hr time frame where you can see the bearish in market i have spotted the support levels are break and you can see the support has been broken where you can see also became weaker this first stance to take entry but be patient you can see the the rsi also overbought and ultimately you can see the price break the support completely and immediately i took entry for short position.
QUESTION:6
Take a Real Trade(crypto pair) on Your Account After a Successful Breakout. (transaction screenshot required).
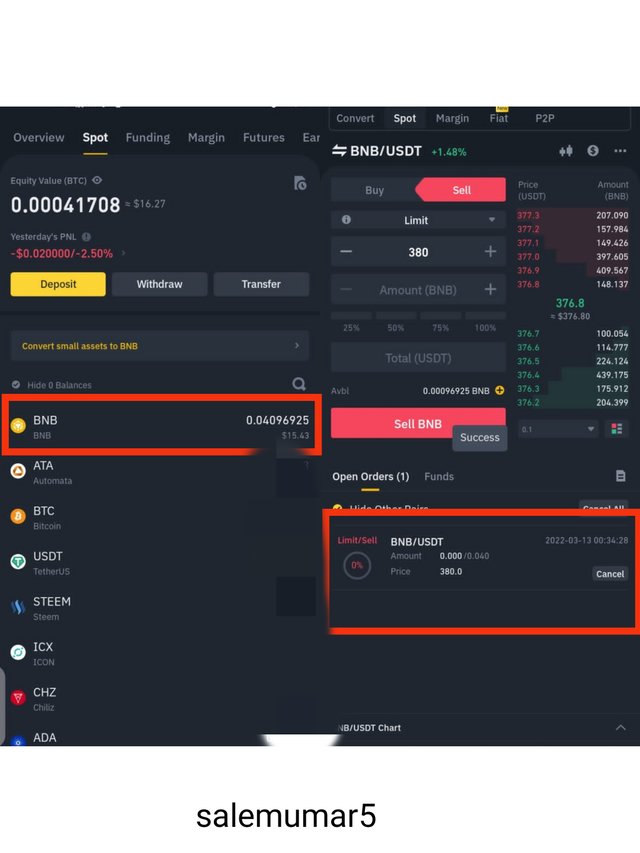
Trade on Real account
Here below chart is bnb/usdt with 1 hr time frame as you can see the support and resistance levels are very volatile i checked many coins but this resistance and support levels are best among them held i see the spot trade where the price breaks the resistance levels multiple times, also Fundamentals are strong too and indicator RSI also provide me a feedback there must be a oversold position in market once and if this break i will acquire 50% trade with profit.
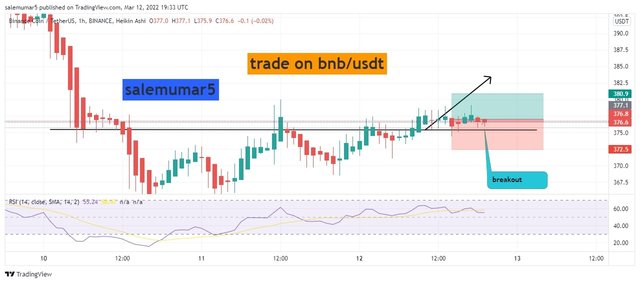
Here my take profit is 380$ which is very advisable and good for short term, as you can see below all trades are very crystal and clear.
QUESTION:7
Explain the Limitations of Support & Resistance (false breakout).
Limitations of support and Resistance
As you a guys aware of that every indicator strategy or technical analysis having lagging because the market always maintained its shaped according to fundamentals although technical analysis plays also a vital role though they just maintain your trade reliable and scalable. Though you need to understand some limitations but its not that mean you ignored support and resistance.
In previous question we had understood the falseness of support and resistance where we got stuck in trades though these false breakout sometimes couldn't meet our criteria thus when you got longterm trades on the basis support and resistance this us very rare they make corrections and futures trader got liquidate though a short term trades are very valuable over here.
Held if we want to avoid them same strategy you have to use the indicators in parralel as you can see above BB and ICHIMOKU plays great role whilst RSI, Volume and MACD are also prevent false signals and get rid of you in false signals.
A good management and Fundamentals can also bring fruitful results to you. Though if you combine these all strategies in parallel you will be a good traders with fruitful results and you will find multiple opportunities.
Conclusion
Support and resistance are one if the important aspect in crypto these are key understanding for every traders these levels justify the reversal when they broken or make corrections, held many traders scalo them by combination of support became resistance vice versa. Though its different types are also very knowledgeable and interesting feature for me to judge the market in more fruitful way.
Thanks professor @shemul21 for providing us such a knowledgeable lecture and rewind our thoughts regarding this topic.
