Steemit Crypto Academy Season 6 Week 4 : CRYPTO TRADING STRATEGY WITH MEDIAN INDICATOR @salemumar5

QUESTION:1
1-Explain your understanding with the median indicator.
Introduction and Understanding about Median indicator
The median price indicator having ATR features in which tells the midpoint of price according to the time frame sett howbiet some people say it's average price but its not that like although Median indicator is basically famous because of his volatility assurance, the indicator pretends best practices in the market whilst making the price action in a lead structure maintaining perfect combination in a volatile market.
Howbiet the indicator also ensure the current trends in market by maintaining upward and downward directions these directions are based upon uper and lower bands in indicator which provides the market a balance combination in a volatile stage among there are high and low volatility stages which is enabled by the bands also the indicator accumulate the downtrend and uptrend by a bullish and bearish cycle with price actions.
Though this Indicator is a mixture of multiple indicating tools which maintains the price action in balancing mode where traders can easily extract fruitful results in market. The indicator also drives ATR with in it by evaluating the lower and uper lengths making support and resistance with price action. Although you can also signifies the trends and reversal in market by attaining the momentum of price action these were eaisly extract for long term easily held by short term there are lagging periods are embedded.
The median indicator having a cloud like structure which is in purple to green colour experience the traders bullish and bearish zone. Held the median line crosses above EMA a bullish signal making a green cloud in median indicator whilst for the besrish trend median line crosses below EMA.
QUESTION:2
2-Parameters and Calculations of Median indicator. (Screenshot required)
Parameters and its calculation
Median calculation
The median indicator calculation is based on median and EMA which ascertain by the upper and lower band above and below the median line which also includes the ATR which multipliers by the two bands upper and lower, the calculation is shown below.
Median value = highest price + lowest price / 2
Upper band = Median length + (2ATR)
Lower band = Median length - (2ATR)
The length of median shows the points use in indicator which is default 3.
Median ATR is accumulate by the period of time by ATR length use in median indicator which is default by 14
- The ATR is is multiple by the upper and lower bands to accumulate the price resistance which us set by default 2
Median length = period of observation which is occured by the period of times
Parameters of median
The parameters of indicator are extracted from tradingview where you can enrolled all the basic parameters of median indicator lets explore them in detail.
1-When you get in ti the tradingview you have to click on top left corner which i enlightened and select the median indicator. Where you can see the first drop-down is of input where you can check the ;
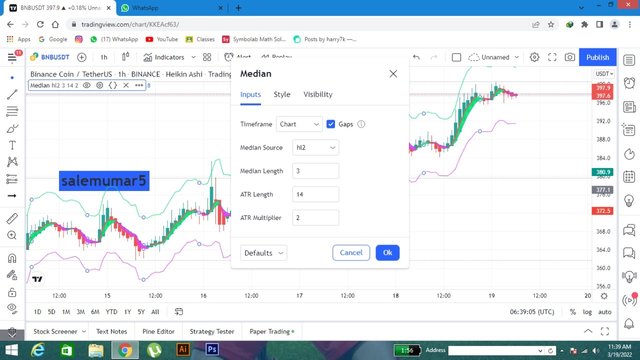
- Time frame which us default as per your chart.
- Median score is hl2.
- Median length is 3 which is the points use in the Indicators.
- ATR length is 14 as oer the period of time accumulation.
- ATR multiplier is 2.
This option style is related to your means which you feels ease to use the indicator which includes the following;
- Median with red color.
- Upper band with greencolor.
- lower bands with purple color
- Plots are kocated in the charts.
- Median with EMA is blue color.
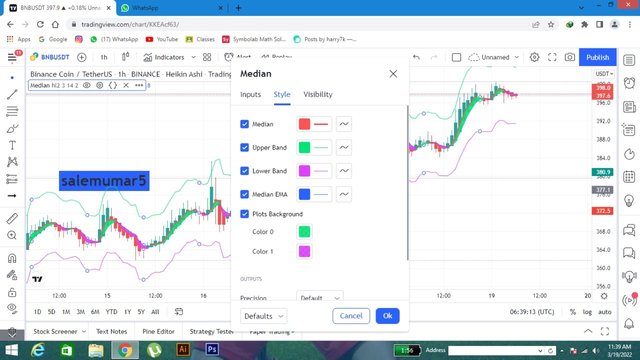
You should have to locate these indicator with correct formation and it will provides you the smoothing texture while assuming the bearish and bullish trends.
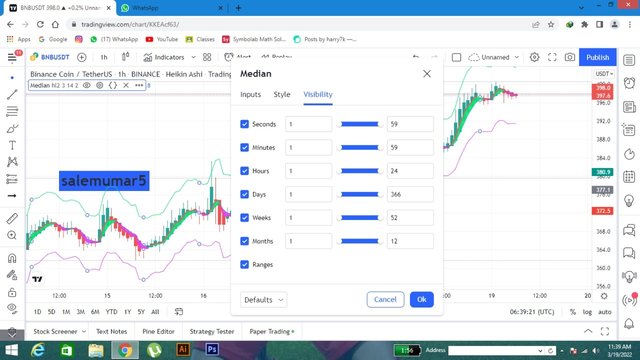
Visibility
Here you can check out the visibility of indicator according to time frames which is sett default in sec, mins, hour, week and months.
QUESTION:3
3-Uptrend from Median indicator (screenshot required) & Downtrend from Median Indicator (screenshot required)
Bullish trend with Median Indicator
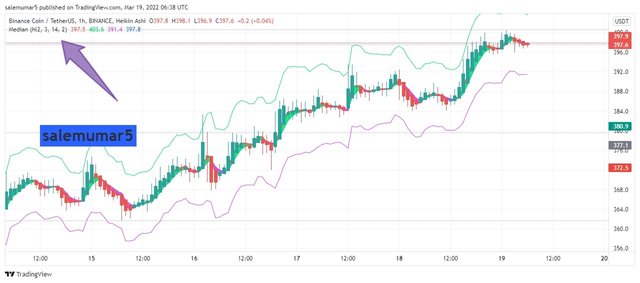
The median indicator also reflects the bullish trends in market which maintains the chart with moving average, where the EMA encourages the market in uptrend to predict this bullish trend also the price would be above EMA since with median its signify that when the median line is above EMA whilst EMA in bullish mode price above the EMA the next candle will signals the buy signal ehich totally describes the uptrend in market.
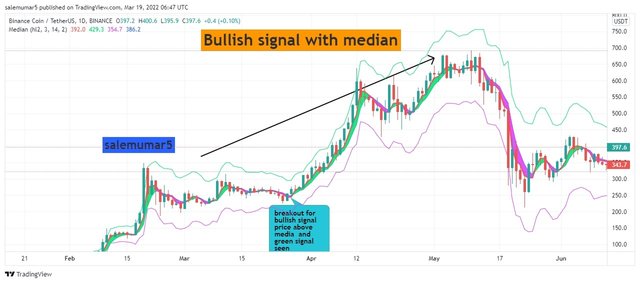
The chart above is /usdt where you cans see the price breaks the resistance and MEDIAN indicator moving them in bullish cycle price is above EMA making green clouds forming an uptrend in market just below their you should make your buy position and stop loss according 1:2 RR.
QUESTION:4
4-Downtrend from Median Indicator (screenshot required)
Bearish trend with Median Indicator
The median indicator also reflects the bearish trends in market which maintains the chart with moving average, where the EMA encourages the market in downtrend to predict this bearish trend also the price would be below EMA since with median its signify that when the median line is below EMA whilst EMA in bearish mode price below the EMA the next candle will signals the sell signal which totally describes the uptrend in market.
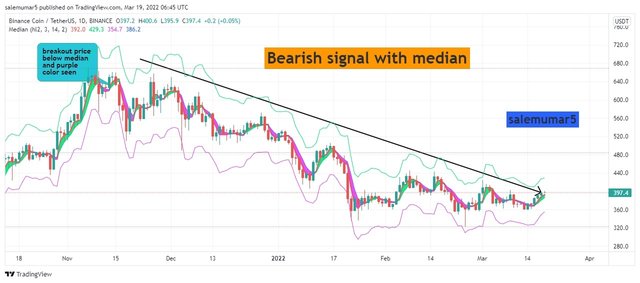
The chart above is /usdt where you cans see the price breaks the support and MEDIAN indicator moving them in bearish cycle price is below EMA making purple clouds forming an bearish in market just above their you should make your sell position and stop loss according 1:2 RR.
QUESTION:5
5-Identifying fake Signals with Median indicator(screenshot required)
False signals with median indicator
As you all guys are know aware of that not all indicators are perfect they must need a supportive indicators in parralel to drive the false and negative trends maintain by the market. Held in median this Indicator is good in volatile market but up to some extent not all the trades are the opportunity inculdes some false signals. So you need to add multiple indicator to make your trade more confidential, reliable and secure.
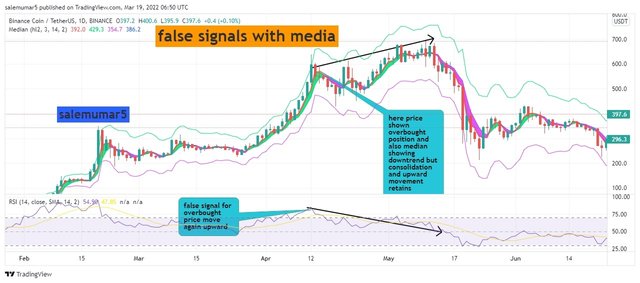
Here the best indicator to drive false signals are MACD and RSI where i will also use the support resistance strategy to analyse the market sentiment which is drive from median as false results and trades.
QUESTION:5
6-Open two demo trades, long and short, with the help of a median indicator or combination that includes a median indicator (screenshot required)
Demo trades with median indicator
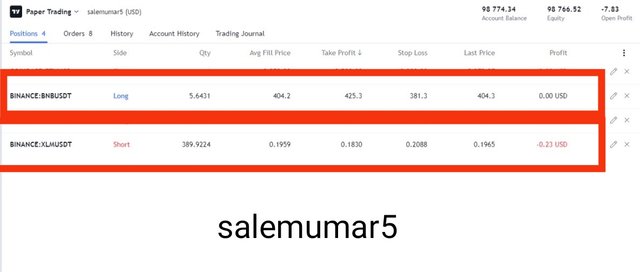
The demo trades is very good practical approach which enhances the ability of our trading i will use median Indicator along with parralel indicator which resultant me a false signals though we can judge
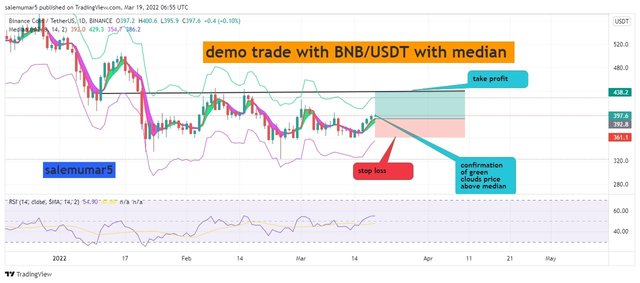
demo trade with Median for BNB/usdt:
The chart shows BNB/USDT coin with day time frame where you can see the price is above the median indicator and here the green clouds are obtained, so out my trade for entry in long position where you can see the take profit is according to 1:2 and stop loss with in it. Also i maintain my trade more valuable by implementing the rsi advance where the breakout is obatined though there might be this target achieve also i used support and resistance to take this profit ratio.
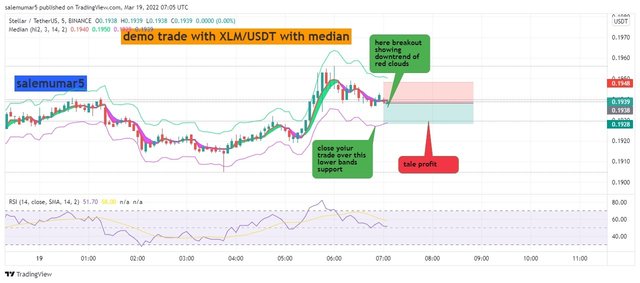
demo trade with Median for XLM/usdt:
The chart shows XLM/USDT coin with day time frame where you can see the price is below the median indicator and here the purple clouds are obtained, so out my trade for entry in short position where you can see the take profit is according to 1:2 and stop loss with in it. Also i maintain my trade more valuable by implementing the rsi advance where the breakout for bearish trend is obatined though there might be this target achieve also i used support and resistance to take this profit ratio.
Conclusion
The median indicator trend reversal and predict the volatility of market by giving the bullish and bearish trends in market with giving the price a perfect direction by its bands strategies. Though this indicator can be good supportive indicators to use in trading. Though we also observed that indicator signals the market by giving green and purple ventures to demonstrate the uptrend and downtrend in market whilst the bands also provides the resistance and support towards the price.
The median indicator can be a good tool for trading market though appreciation towards professor who demonstrate us the indicator in simole and easy manner.