Steemit Crypto Academy | week 2 by professor @stream4u - How To Read Candlestick Charts In Different Time Frame & Information about Buy-Sell(Support & Resistance).
Steemit Crypto Academy | week 2 by professor @stream4u - How To Read Candlestick Charts In Different Time Frame & Information about Buy-Sell(Support & Resistance).
Fellow steemians, In this post i will be expalinining how candle stick works and when is one expected to buy or sell the crypto coin.
Explain with Candle Chart, what are the time frames available that we can set into the chart, and why it needs to change the candle time frame?
It's important to mention here that in trading, time is of essence i.e time it self is a very significant resources and should not be joked with. In crypto market prices changes as they time changes. If you observe they price of a certain coin and then give it a little time again say 1,2,3,4,5 minutes or even an hour, you will discover that they price after these little time will either increase or decrease hence they need to understand the candlestick chart. Below is an image showing Candle chart.
What type of traders available in the market, explain how they work?
The following are the different types of traders, so which one are you or you want to be?
It's obvious that we all don't have same capacity when it comes to trading i.e some have enough to invest while others are searching for the once to use within a very short period of time.
Scalping:
Traders in these category, carry out their trade in a very short time frame. When ever any price movements sets in in the market, they take advantage of that.These type of operations are real quick and do not exceed a few minutes or hours. Actually, no much profit is made from this, unless you have a huge amount to invest, and as soon as you place your buying order, you're already setting the selling one. These are traders who don't invest for long.
Short term trading:
You hold your position for a bit longer than in the scalping, but not that much. You have a particular goal, that which You really want to achieve. Your intention with this type of trades is to just make a slightly better profit than with scalping, but you're not really into holding your position in that asset.
Long term trading:
Here in these category, they can also be called Swing traders. Here, traders place and hold their trade positions for a very long time. For example; they hold trades for weeks, months and years.
They are actually the highest holders of coins because they buy and allow it for a long period of time.
Reading Candlestick charts in the different timeframes
Candlestick:
A candlestick chart is a type of financial chart that graphically represents the price moves of an asset for a given timeframe. It started with Japanese rice vendors and merchants to screen the market costs and the every day energy, hence the name "Japanese candles".
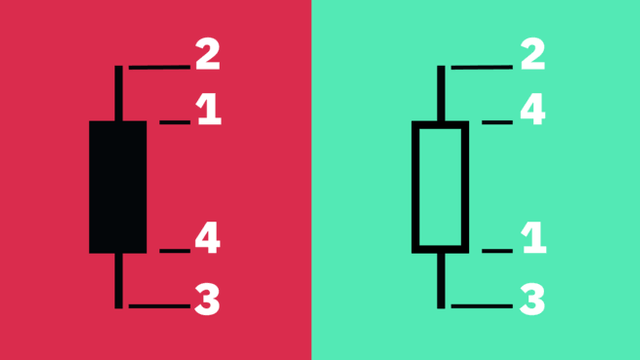
Explain what is the meaning of the Green and Red candle and how to read the Green and Red candle, with candles image.
Kinds of Candlestick:
There are two kinds of Candlestick.
- Bullish Candlestick:-
.jpeg)
Source
The Green Candle stick this is also call the bullish candle ,it represent an uptrend movement, below is a picture explanation of itself.
- Bearish Candlestick:-
.jpeg)
Source
This indicates a down trend and it is also called the bearish candle stick it has same features as the green candle stick , but with a slight difference.
How do candlestick charts work?
To create a Candlestick you need the following price points.
Open — The first recorded trading price of the asset within that particular timeframe.
High — The highest recorded trading price of the asset within that particular timeframe.
Low — The lowest recorded trading price of the asset within that particular timeframe.
Close — The last recorded trading price of the asset within that particular timeframe.
In trading or investing in assets, what is the importance of Support and Resistance, explain how they work?
These two things are very important for your career and if you know how to make your money by using these two levels, you can understand a lot more things in Forex. People only use their strategy and analyses in Forex but they also need to analyze the market from other angles. The support and resistance level can provide you important information that can give you an edge over the market. When successful traders trade, they are not using the strategy and analyses that all the other people use.
They try to know as much information as they can and use them in their charts. These support and resistance level is a good indicator of when the prices are going to fall and when they are going to rise up in Forex. This article will tell you the role of Forex support levels and resistance levels in your trades. If you read this article, you will find that much of trading strategy is incomplete without support and resistance levels.
Source
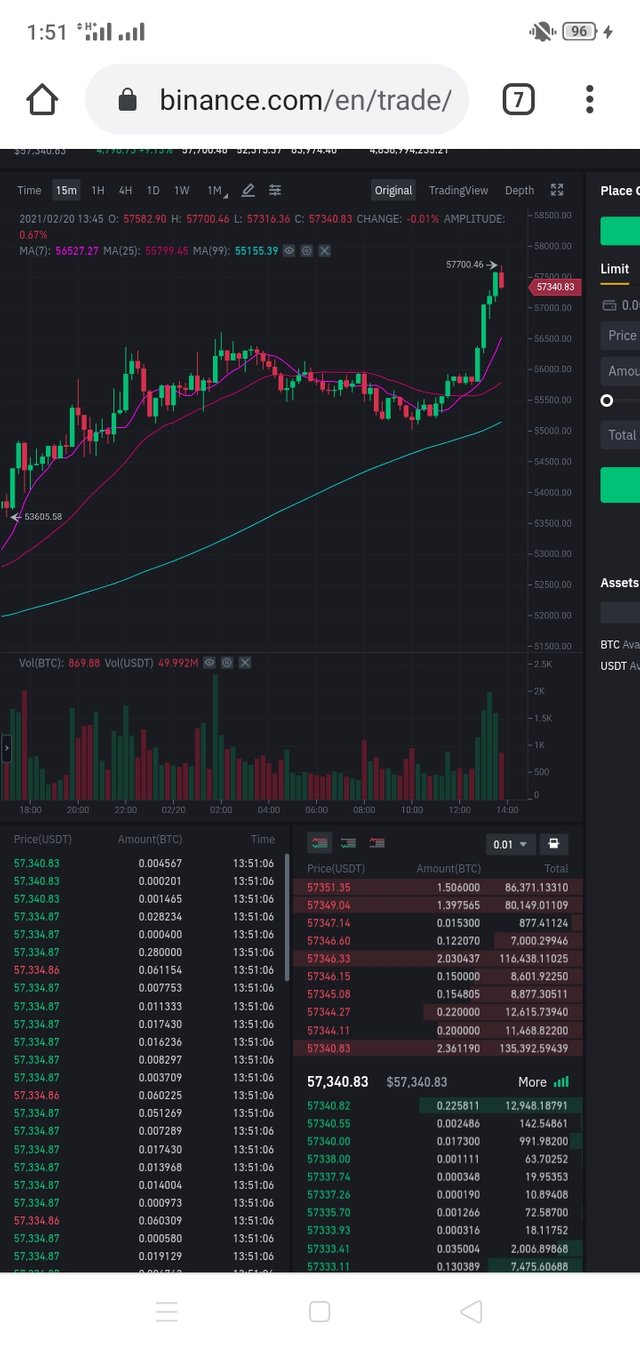
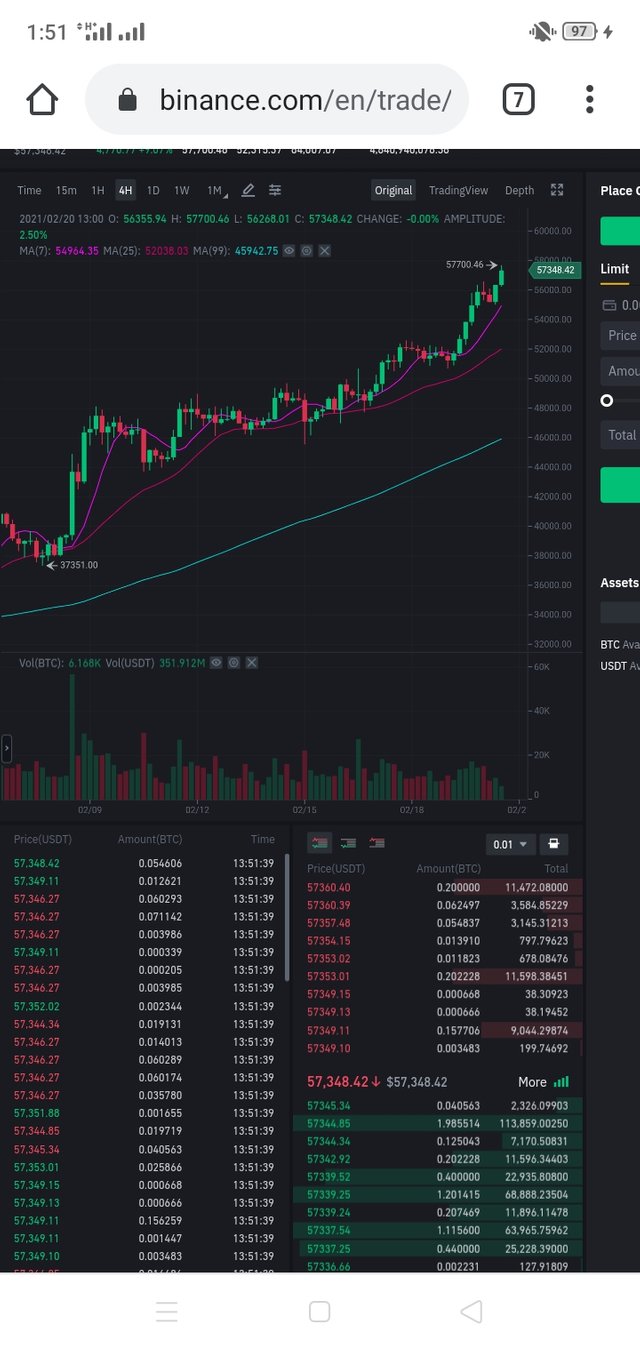
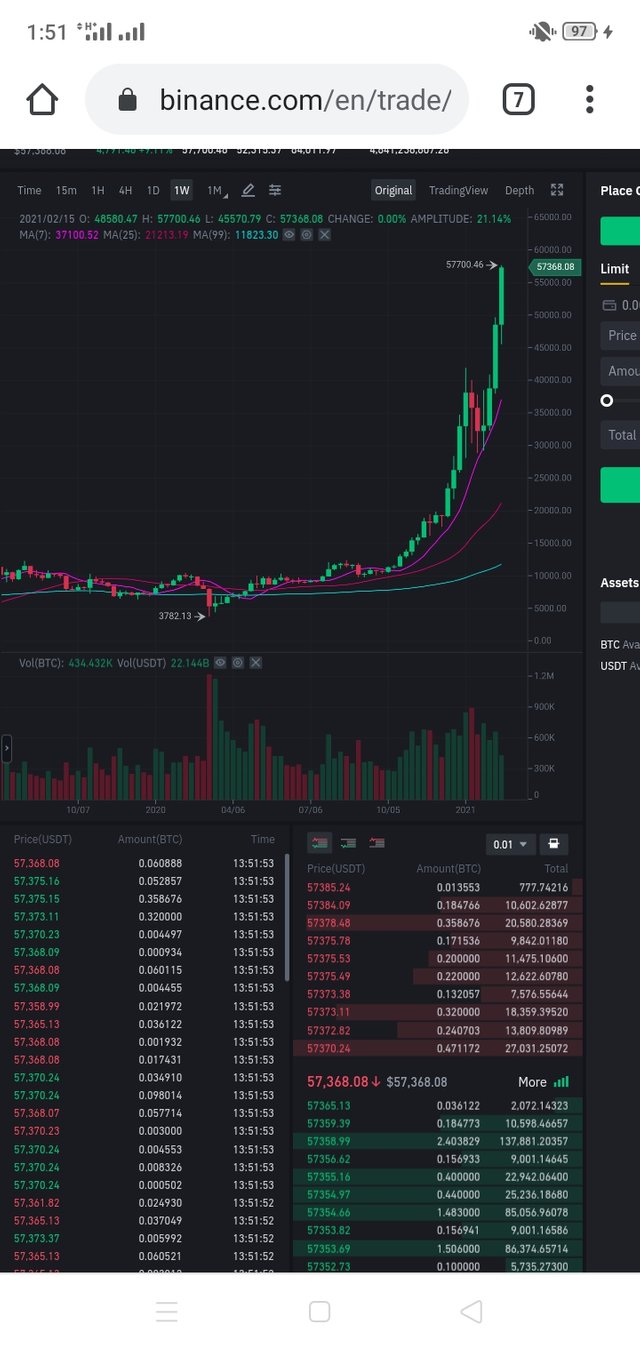
Show any particular asset candle chart in a different time frame and explain in short what you see in the chart, like which trend we see, what are the price levels. (Screenshot Needed)
Below are few screenshot of chart of bitcoin trade for 15m, 1H, 4H, 1D and 1W respectively. These, shows how bitcoin has been raising for the past one week.
How we can find the Support in the candle chart, explain with one of the asset Candle charts with screenshot and point the levels
.jpeg)
Source
By analyzing graphics, we can predict some of the movements of the assets. In trading, there is a fundamental rule that has to do with support and resistance. “We buy at support and sell at resistance.” This should be your song always while dealing with the crypto trading arena. We say there's a resistance when the uptrend in a price gets up to certain point and then it's hard for it to get past it. On the opposite direction, there's a support when the price can't go lower than certain point, these are the opportunities we should take advantage of to buy position. As a trader, when you approach any market, the first thing you need to establish on your trading chart is the support and Resistance zones because these guide you in identifying good entry points for both selling and Buying time.
Hi @simonnwigwe
There are total 7 topics given in the Homework Task, Kindly find the same here
Kindly add all topics and update this homework task with your information.
Also, a couple of content in this post detected as Plagiarized which means copied and pasted from certain sources. Below are the same.
Further, I can see it seems taken from a post made by @yohan2on
Can you please attach the sources to those particular phrases in your article? OR phrase/explain it in your own way.
Thank You.
@stream4u
Crypto Professors : Steemit Crypto Academy
#india #affable
Hello sir @stream4u I have made corrections on my work please do well to check it once again.
Thank You.
__
Thank You For Showing Your Intrest in Steemit Crypto Academy
You have completed the homework task and made a good post, explained very nicely about How To Read Candlestick Charts In Different Time Frame & Information about Buy-Sell(Support & Resistance).
Remark: Homework Task Completed.
Thank You.
@stream4u
Crypto Professors : Steemit Crypto Academy
#india #affable