[Confluence Trading] - Crypto Academy / S5W6- Homework Post for @reminiscence01

Hello Steemians, It is a great privilege to be a member of this academy. This week prof @reminiscence01 gave a general overview and the importance of confluence trading. I will be doing the homework task from the lecture.
.png)
1: Explain Confluence trading. Explain how a trade setup can be enhanced using confluence trading.
Confluence Trading
Confluence trading is a trading strategy that involves using two or more technical tools or trading strategies to make a trading decision. Trading signals received from 1 technical tool or indicator can not be trusted to be 100% efficient as many are at best 80% efficient. The use of 2 or more technical tools to receive trading signals becomes highly important as they help filter each other's false trading signals.
Confluence trading can combine two or more technical indicators, a mixture of a technical indicator with price pattern or chart overlays tools. The concept of confluence trading is open as long as it involves technical analysis tools combined to confirm a trading signal or filtering of false alerts.
For instance, the combination of the Bollinger band and relative strength index indicators can confirm trade signals and filter false signals given by each other. The Bollinger bands consist of three lines; two of the said lines are the upper and lower bands that act as dynamic support and resistance levels and the third line in the middle. Price interactions with these lines give trade signals. Meanwhile, the relative strength index has overbought and oversold levels to provide trade signals.
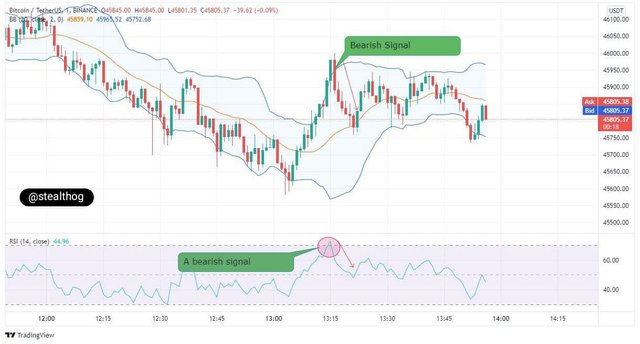
From the BTCUSDT chart above, the price broke above the Bollinger band upper line to show a strong bullish trend. A trend reversal was spotted as the price fell below the upper band to signal a trend reversal. There was a confluence of the trend reversal signal as the relative strength index line moved up and crossed above the 80% line to signal an overbought asset which is a trend reversal signal. The signal was accurate as price in a different direction became a bearish market.
2: Explain the importance of confluence trading in the crypto market?
Importance Of Confluence Trading
It is essential to combine two or more trading strategies to form a confluence trade, and its importance is outlined.
- Confirm Trade Signal
Confluence trading is the combination of 2 or more trading strategies. This brings about trade confirmation as the trader can look at the variety of signals given to confirm a trade decision.
- Confidence in Trading
Having confidence in a trade is very important as emotions play a vital role in a trader's success. Confluence trading gives the trader confidence in his trading decision as the trade signal must have been confirmed by two or more trading analysis tools.
- Filters False Signals
False signals are filtered when trading with two or more technical analysis tools. The use of more than one technical tool is essential as most technical analysis tools and indicators have efficiency scores below 80%, as such not advisable to be used alone for the financial market, which is volatile, particularly crypto trading.
- Good Risk Management
Good risk management is a way to ensure good trading practices are followed to prevent the liquidation of trading capital and ensure profit. Confluence trading ensures the trader makes trade decisions of confirmed signals, reducing risk and improving the trader's confidence in the trade.
3: Explain 2-level and 3-level confirmation confluence trading using any crypto chart.
2-Level Confirmation Confluence Trading
This level of confluence confirmation involves a trade signal from two technical analysis tools to enter a trade. The signals can be from any technical analysis tool that best suits the trader.
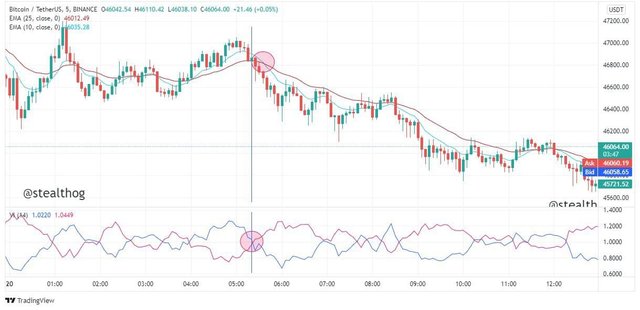
On the BTCUSDT chart, 2-Level confirmation confluence level trading was used. EMA 25 and EMA 10 indicators were added to the chart and gave a sell signal when the EMA 10 lines crossed below the EMA 25 line and price crossed below the 2 EMA lines. The Vortex indicator confirmed the bearish trend signal when the -VI (red) line crossed above the +VI (blue) line, signaling a bearish trend.
3-Level Confirmation Confluence Trading
3-3-Level confirmation confluence trading combines three technical analysis tools to confirm a trade signal. A trader using a 3-level confirmation confluence trading makes sure the three indicators or technical analysis tools present on the chart give the same trading signal before entering a trade.
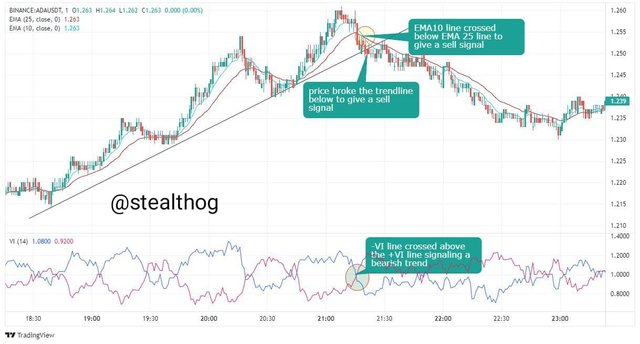
On the ADAUSDT chart, there was a 3-level confirmation confluence that involved trading signals from three different technical analysis tools. The EMA 25 and EMA 10 strategy, trend-line strategy, and the vortex indicator.
The EMA 25 and EMA 10 lines crossed each other to give of trade signal. On the ADAUSDT chart, the EMA 10 line crossed below the EMA 25 line to provide a sell signal as price also crossed below the two EMA lines confirming the sell signal.
A trend-line was drawn on the previous uptrend, and after several tests by price on the trend-line and bounce off, the price finally broke the trend-line to indicate a trend reversal and give a sell signal.
The vortex indicator uses the +VI line (positive line) and the -VI line (negative line). The interaction between the vortex indicator lines gives trade signals. On the ADAUSDT chart, the negative vortex line crossed above the positive vortex line to provide a sell signal.
The three signals were used to confirm a bearish trend or a sell signal on the chart.
4: Analyze and Open a demo trade on two crypto asset pairs using confluence trading. The following are expected in this question.
a) Identify the trend.
b) Explain the strategies/trading tools for your confluence.
c) What are the different signals observed on the chart?
LUNAUSDT (Bearish Confluence Signal)
.jpg)
- Identifying Trend
On the LUNAUSDT chart price was moving in an uptrend. A bullish trend was identified using signals from the exponential moving averages line as the EMA 25 and EMA 10 moved below the price. Also, the vortex indicator positive line (blue line) moves above the negative line (red line) to confirm the bullish trend identification.
- Confluence Strategy
The confluence strategy used is a 2-Level confirmation confluence trading strategy as it has to do with signals from 2 different indicators to receive trade signals.
The first indicator is the exponential moving average, and we will be using the EMA 10 and EMA 25. The EMAs give signals from their interactions with one another and their interactions with the price. A bullish signal is received when the EMA 10 line crosses and moves above the EMA 25 line, and both of the EMA lines are moving below price and vice versa for a bearish signal. The EMA lines act as dynamic support and resistance zones for price action, and any intersection with price gives a trade signal.
The second indicator in this confluence trading is the vortex indicator that uses two lines, the positive line (+VI ) styled in the blue color and the negative line (-VI) styled in the red color. The vortex indicator gives trade signals when the blue and red lines intersect. The blue crosses above the red line to give a bullish signal, and the red line crosses the blue line to give a bearish signal. Whenever any vortex lines peak and start to dip, it is a trend reversal signal.
- Signals Received
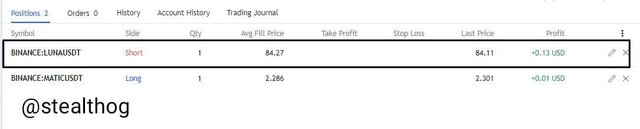
The LUNAUSDT chart price was moving in a bullish trend, then a bearish trend reversal signal was received when price crossed below the EMA lines and the EMA 25 crossed above the EMA 10 line. The vortex indicator confirmed the bearish signal when the negative line crossed above the positive vortex line. A sell order was entered, and trade was in profit.
SANDUSDT (Bullish Confluence Signal)
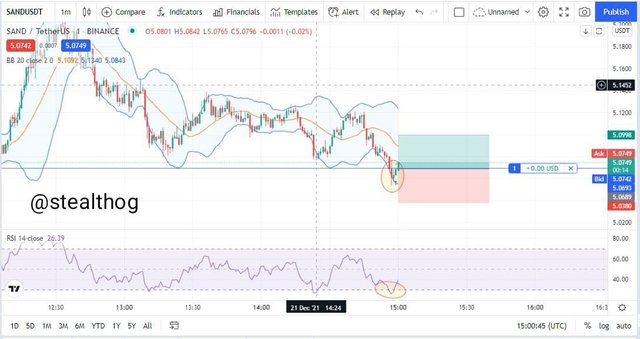
- Identifying Trend
On the SANDUSDT chart, price was moving in a bearish trend. A bearish trend was identified using signals from the Bollinger band as price crossed below the third EMA line and kept moving between the middle EMA line and the lower band of the Bollinger band. The trend identification was confirmed as the RSI line was moving downwards.
- Confluence Strategy
The confluence strategy used is a 2-Level confirmation confluence trading strategy as it has to do with signals from 2 different indicators to receive trade signals.
The first indicator is the Bollinger bands indicator consisting of three lines, the upper and lower bands, and the EMA line. The upper bands and lower bands act as dynamic support and resistance, and price interactions with these bands give a trade signal. Also, the Bollinger bands indicator has a third line, an exponential moving average that interacts with price to give trade signals. If price moves below the EMA line and trends between the lower band and the EMA line, it is a sell signal and vice versa for a buy signal.
The second indicator in this confluence trading is the relative strength index indicator that uses two levels, the overbought (80 %) and the oversold level. If the RSI line crosses above the overbought level, it means the asset is overbought, which is a sell signal, and if the RSI line crosses below the oversold level, it means the asset is oversold that is a buy signal.
- Signals Received
The SANDUSDT chart price was moving in a bearish trend; then a bullish trend reversal signal was received when the price tested the lower band (support zone) and bounced off, indicating the start of a bullish trend. The relative strength index indicator confirmed the bullish signal when the RSI line crossed above the oversold level from below to confirm the buy signal.
Conclusion
Confluence trading is a trading strategy that involves using two or more technical analysis tools or indicators to make trade decisions. There are 2-level and 3-level confirmation confluence trading, and they involve the use of two and three indicators or analysis tools to confirm trade signals.
Thank you, prof @reminiscence01.
Hello @stealthog, I’m glad you participated in the 6th week Season 5 of the Beginner’s class at the Steemit Crypto Academy. Your grades in this task are as follows:
Observations:
That's correct.
Recommendation / Feedback:
Thank you for participating in this homework task.