[Crypto Trading Using Trix Indicator] - Crypto Academy /S6W3-Homework Post for professor @kouba01

Hello Steemians, I hope it was an excellent weekend for every one of us, and it's nice to be back to learning after the two weeks trading contest. This week prof @kouba01 gave a lesson on crypto trading using the Trix indicator, and I will be doing the homework task from it.

1. Discuss in your own words Trix as a trading indicator and how it works
Trix Indicator
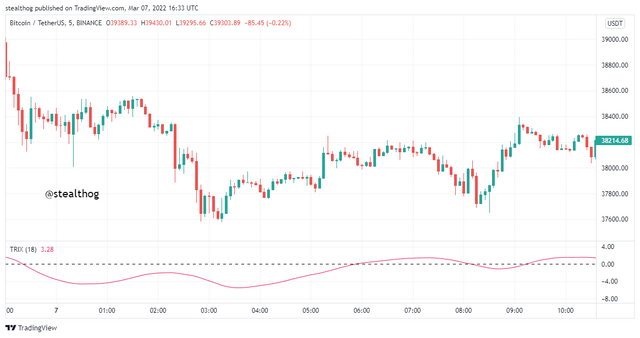
The Trix indicator, also known as the triple exponential indicator, is a technical indicator that uses the triple smoothing of moving averages to filter noises or insignificant price fluctuations from the market. Developed by technical analysis editor Jack Hutson in the 1980s. The Trix indicator shows the percentage change rate of moving averages.
Also, the Trix indicator giving positive and negative values at different points in the market indicates overbought and oversold levels as an oscillator indicator. It can also be used as a momentum indicator identifying strength in trends (uptrend and downtrend). It is similar to the MACD indicator but smoother due to filtered noise.
How does the Trix Indicator work
The triple smoothing of the moving averages was done to help reduce lag common with moving averages and reduce false signals, and filter price fluctuations. The Trix indicator comprises components that include the zero line and the percentage scale. Technical traders use the Trix indicator to trade by identifying specific interactions with the parts of the indicator.
When the percentage scale gives a highly positive or negative value to indicate an overbought or oversold market, traders take this as a trade signal and initiate a sell trade when the market is overbought and a buy trade when the market is oversold.
Also, the Trix indicator has a zero line, and when the Trix line crosses the zero line from bottom to top, it is seen as a buy signal, and when the Trix line crosses the zero line from top to bottom, it is seen as a sell signal. The Trix indicator also uses divergence and signal line crossovers to give off-trade signals.
2. Show how one can calculate the value of this indicator by giving a graphically justified example? how to configure it, and is it advisable to change its default setting? (Screenshot required)
Trix Indicator Calculation
As with many technical indicators, the Trix indicator can be calculated using a formula. The formula and steps used in calculating the Trix indicator are given below.
- Step 1: Calculate the first exponential moving average. An exponential moving average is used as it focuses on closing prices
EMA1(i) = EMA(Price,N,1)
Where,
EMA(i) = Exponential moving average current value
= price
N = Period
- Step 2: The derived exponential moving average is then smoothed to get a double exponential moving average
EMA2(i)=EMA(EMA1,N,i)
- Step 3: The double exponential moving average is smoothed one more time to get a triple exponential moving average, given below.
EMA3(i)=EMA(EMA2,N,i)
- Step 4: The Trix indicator formula is then given as
TRIX = (EMA3 t - EMA3 t-1) / EMA3 t-1
Trix Indicator Configuration
The configuration of the Trix indicator is done on a chart, and I will be using the trading view technical analysis chart platform for this task.
Firstly, I visit the tradingview platform. Then I click on the chart. I click on the indicator button on the chart page and search for the Trix indicator on the search bar.
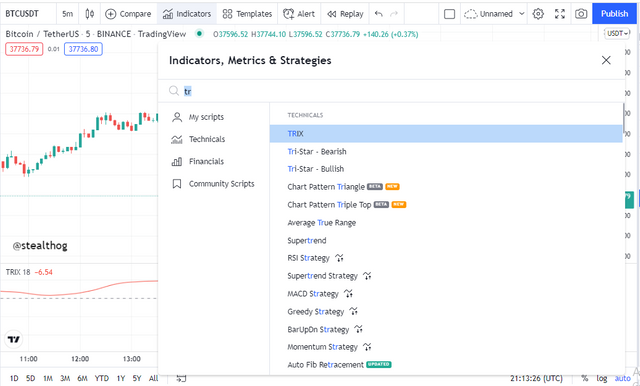
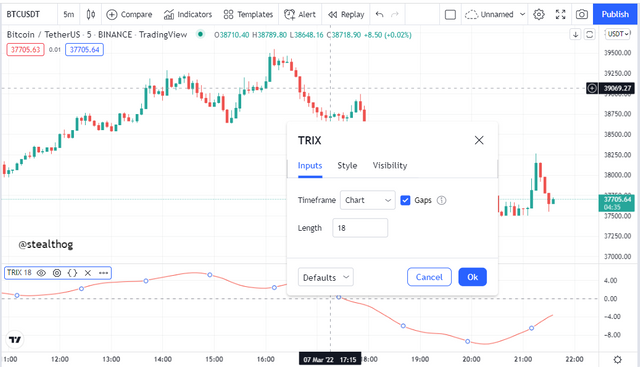
The Trix indicator is added to the chart. On the Trix indicator menu bar, click on settings to configure the Trix indicator.
On the settings pop-up display, click on inputs. The default length (period) is given as 18.
On the style section of the indicator settings, the zero line has a default colour setting of grey, and the Trix line as a default colour setting of red
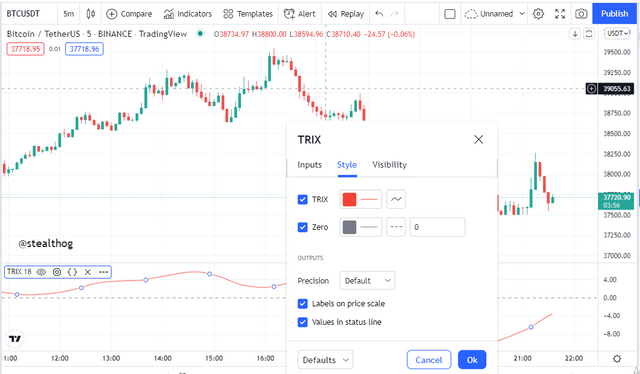
The Trix indicator has been added to the chart and configured as shown above.
It is advisable to customize the default Trix indicator settings. The default period setting for the Trix indicator is 18, but depending on the time frame and the trader trading style, the default settings can be changed to suit them. The period settings determine how much noise is filtered in the market and how the indicator gives many trade signals. Also, traders commonly use 14 and 15-period lengths, but a larger trading time frame requires a more extended period.
3. Based on the use of the Trix indicator, how can one predict whether the trend will be bullish or bearish and determine the buy/sell points in the short term and show its limits in the medium and long term. (screenshot required)
Traders using the Trix indicator can predict trend directions (bullish or bearish) and determine entry points (buy or sell) in the market by identifying signals given by the Trix indicator. The Trix indicator shows a trade signal through its interaction with the zero line and the change in the direction of the Trix line.
A buy point or a bullish trend is identified when the Trix line crosses above the zero line from below. It is also believed that a bullish trend is to occur when the Trix line changes its direction from a bearish or downtrend movement to a bullish or uptrend move, as it has reached the oversold level in the market and a trend reversal is imminent.
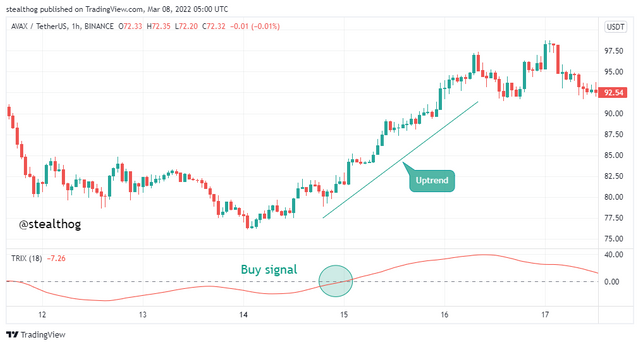
From the AVAXUSDT chart above, the Trix line crossed the zero line above to give a buy signal, and price continued in an uptrend.
A selling point or a bearish trend is identified when the Trix line crosses below the zero line from above. It is also believed that a bearish trend occurs when the Trix line changes its direction from a bullish or uptrend movement to a bearish or downtrend movement. As it has reached the overbought level in the market, a trend reversal is about to happen.
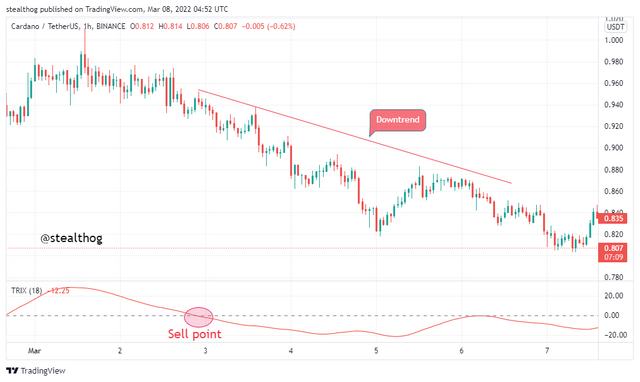
From the ADAUSDT chart above, the Trix line crossed the zero line below to give a sell signal and price continued in a downtrend.
Using Trix Indicator in the Short term
Using the Trix indicator for trading points on a short term basis will involve using a short time frame like the 15 minutes time frame. The Trix indicator period settings will also be customized to a setting of 15. The Trix indicator on a shorter time frame will generate more signals.
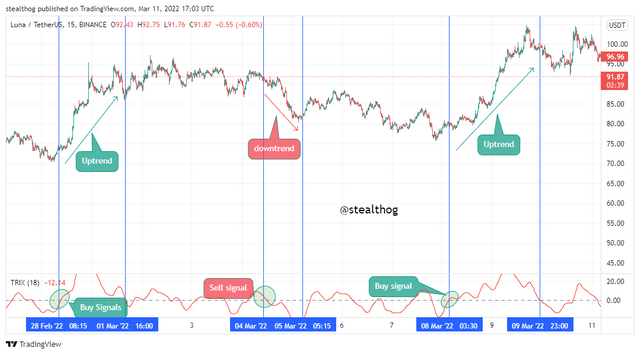
From the chart above, the Trix indicator gave lots of false trade signals and few trade signals that were accurate. The distorted signal is because of the change in the period settings has the smoothing of the triple exponential averages has been reduced.
Limitations of Trix indicator in Medium and Long Term
The Trix indicator's primary property is that it filters noise given by small fluctuations in the market. This is a general advantage of the Trix indicator. Still, it might be a disadvantage for the medium and long term as the Trix indicator will give a lesser trade signal through accuracy.
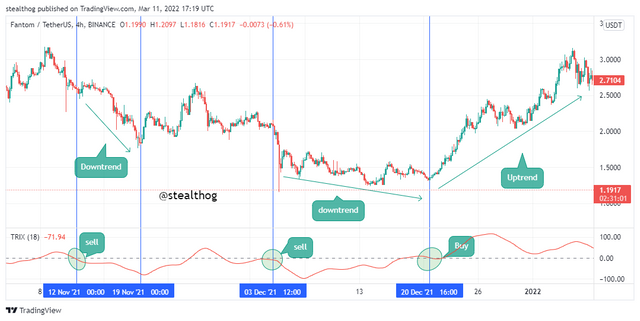
The chart above showed that the Trix indicator filtered all the market noise and gave fewer signals than short-term use. Price action was smoothed on the Trix indicator, ignoring some actual trade points.
4. By comparing the Trix indicator with the MACD indicator, show the usefulness of pairing it with the EMA indicator by highlighting the different signals of this combination. (screenshot required)
Comparison Between the Trix indicator and the MACD indicator
The Trix indicator is very similar to the MACD indicator but differs in a few aspects. The first and most noticeable difference is how they react to price actions and small fluctuations. Due to the triple smoothing of the Trix indicator, it gives a smoother flow when compared to the MACD indicator that reacts more to price actions.
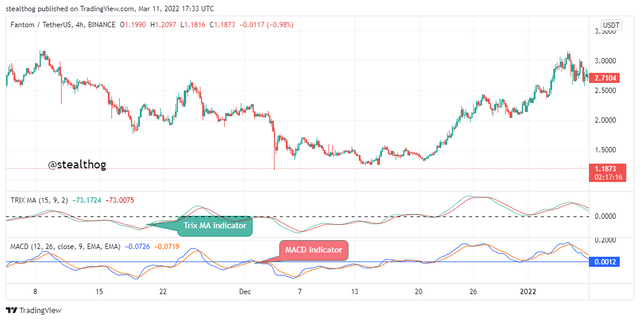
On the chart above, the Trix MA indicator (settings Trix period 15, EMA 9) and the MACD indicator (settings 12,26,9) were added to it. The chart shows that the flow of the Trix MA indicator lines is smoother but reaction late to price change when compared to the MACD indicator that has a rougher flow because it reacts more and faster to price change.
The chart above shows that the MACD is faster to react to price and, as such, give a more immediate trade signal when compared to the Trix MA indicator. Also, the signals received from the Trix MA are usually accurate.
5. Interpret how the combination of zero line cutoff and divergences makes Trix operationally very strong. (screenshot required)
Zero Line Cutoff Paired with Divergence
Using the Trix indicator, the zero line cutoff is a trading strategy that signifies trade points in the market. When the Trix line crosses the zero line above from below, it is a sign of a bullish trend, and when the Trix line crosses the zero line from above to down, it is a bearish signal.
Divergence in trading means an opposite trend direction. When using the Trix indicator and the Trix line moves in a different direction to that of price, it is a trend reversal signal. Combining the zero line cutoff with the divergence strategy indicates a trend reversal and confirms it.
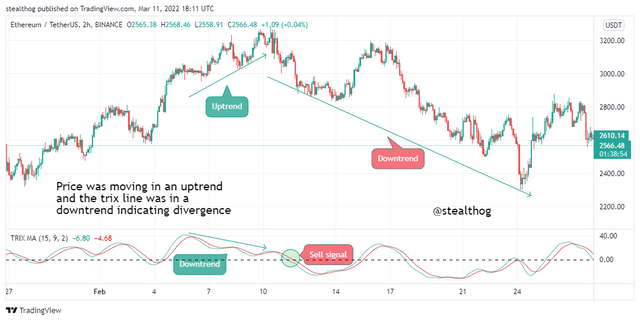
A divergence of price and the Trix line was identified when the price was moving in an uptrend direction, and the Trix line was in a downtrend, indicating a bearish trend reversal. The Trix line cuts through the zero line from above to below, confirming the bearish trend signal. Price move in a downtrend after the zero line confirmation.
6. Is it necessary to pair another indicator to work better as a filter and help eliminate false signals? Give an example (indicator) to support your answer. (screenshot required)
Pairing the Trix Indicator with other Indicators
Confluence trading is always advised as it is better to confirm the trade signal given by one indicator with other indicators. This is no different for the Trix indicator as it is necessary to pair the indicator with other indicators to work as a filter against the false signal.
Trix Indicator and RSI indicator
When the RSI line crosses the 50 point level, the RSI indicator gives trade signals. If the RSI line crosses the 50 point level upward, then it is a buy signal as the price moves to an overbought state, and if it crosses the 50 point level below, then it is a sell signal as price is heading to an oversold condition.
The Trix MA indicator uses the Trix line and the EMA line to give a trade signal. If the Trix line crosses above the EMA line, then it is a buy signal, and if the EMA line crosses above the Trix line, it is a sell signal. Also, crossing the zero line by the EMA line and Trix line gives trade signals. Crossing the zero line above from below is a buy signal and crossing the zero line below from above is a sell signal.
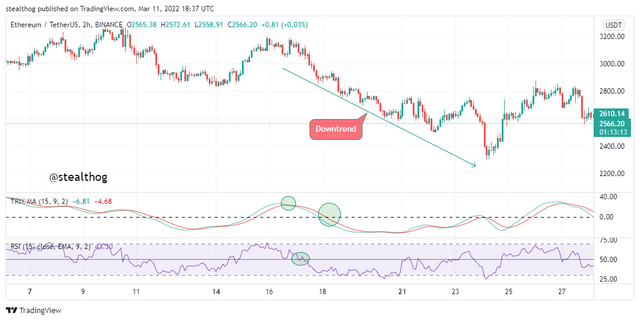
The Trix indicator gave a sell signal when the EMA 9 line crossed above the Trix line. The sell signal was confirmed when the RSI line crossed below the 50 point level. The Trix line crossed the zero level much later as price was already in a downtrend movement.
7. List the pros and cons of the Trix indicator
Advantages of Trix Indicator
The Trix indicator helps filter market noise and gives a smooth flow. This allows traders have a clearer view of the current trend without the distorted price change effects.
The Trix indicator gives trade signals using different strategies like the zero line cut off strategy and the divergence strategy.
The Trix indicator is a faster and smoother indicator when compared to other moving average indicators
Disadvantages of Trix indicator
In shorter time frames, the Trix indicator generates more trade signals of which some of the signals are false.
The Trix indicator ignores some trading opportunities due to its smoothing of price noise.
Conclusion
The Trix indicator is an indicator that filters out market noise through its calculation hence giving it a smoother flow and is easy to interpret. It also reduces the dependency of the EMA closing price and lagging signals. The Trix indicator uses a different strategy to give trade signals that include the zero line cut off, crossovers, and the divergence strategy