[Fibonacci Tools] - Crypto Academy / S6W4 - Homework post for professor @pelon53.
Hello Steemians, how are you all doing? I hope you are fine. This week's lesson by prof @pelon53 focused on the technical analysis tool called Fibonacci. I will be doing the homework task from the study.

1. Explain in your own words what you mean by Fibonacci retracement. Show an example with screenshot
Fibonacci Retracement
A mathematician named Leonardo, born in Italy, discovered the Fibonacci series. The Fibonacci series is a sequence of numbers generated by adding up the previous two numbers. The sequence is given as 0,1,1,2,3,5,8,13,21,34.55.89….. and so on. Also, as the sequence goes up, any number in the series divided by its previous number gives a result that can be approximated to 1.618 called the golden ratio. The Fibonacci sequence has been observed to occur in most aspects of nature. The Fibonacci sequence is used to predict entry and exit points in trading.
Fibonacci retracements are the market levels derived from the Fibonacci sequence ratio represented by horizontal lines. These horizontal lines act as support or resistance for retracements in trends. The Fibonacci levels used in trading technical analysis are 23.6%, 38.2%, 61.8%, 78.6%. The 50% level has been added to the Fibonacci levels, though not a Fibonacci ratio. It has proven to be at a balanced level.
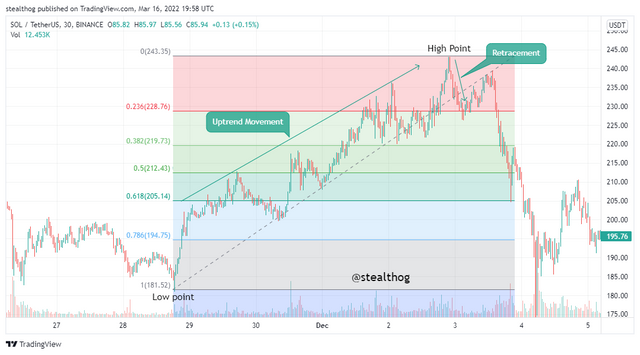
Price does not move in a straight line and experiences retracements or pullbacks. These pullbacks can be measured using the Fibonacci retracement tool by connecting swing points (peaks and trough) in the trend. Having a good understanding of the market structure of trends helps in effectively plotting the Fibonacci retracement.
The Fibonacci retracement is plotted for an uptrend by drawing the Fib tool from the low to the uptrend's high point. The market structure for an uptrend sees price recording higher highs and higher lows. The Fibonacci retracement is plotted to measure the next pullback for an uptrend.
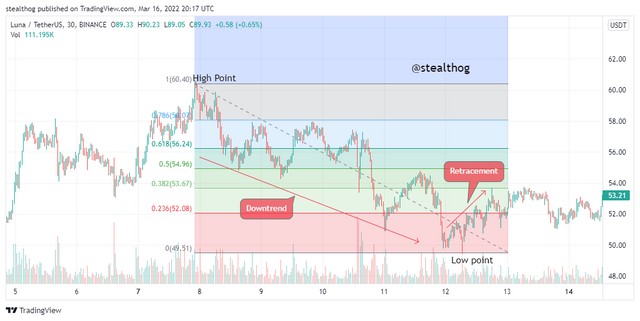
The Fibonacci retracement is plotted for a downtrend by drawing the Fib tool from the high point to the low point of the downtrend. The market structure for a downtrend sees price recording lower highs and lower lows. The Fibonacci retracement is plotted to measure the next pullback for a downtrend.
2. Explain in your own words what you mean by Fibonacci extension. Show an example with screenshot.
Fibonacci Extension
Fibonacci Extension levels are trading levels derived from the Fibonacci series that are used to calculate how far price will extend after a retracement. Like the Fibonacci retracement level, the extension level can be support and resistance levels and show the projection level of price in support of the primary trend. The Fibonacci extension levels are 1.272, 1.414, 1.618, etc.
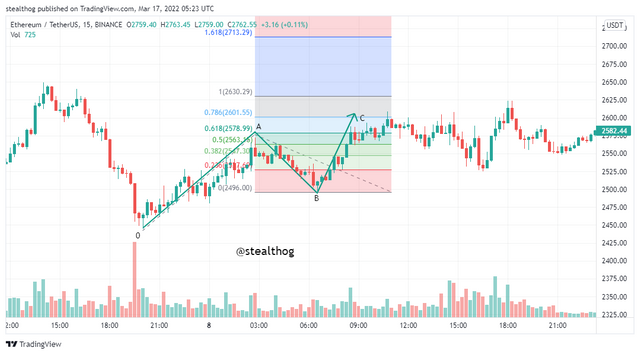
The Fib-retracement tool is drawn from one swing point to another when plotting the Fibonacci retracement level. The Fib extension tool is plotted quite differently. It requires connecting three points in the trend to get the projection level of the trend. Knowing the market structure is necessary for plotting the Fibonacci extension.
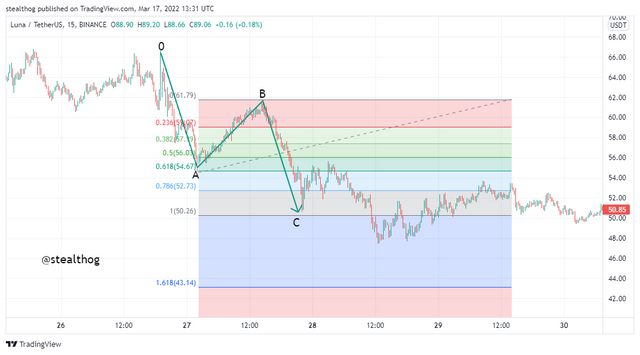
When plotting a Fibonacci extension for an uptrend, the points are plotted from the low points (0) to the high points (A) and then to the retracement low points (B). The Fibonacci extension is plotted to get the price projection after the retracement (C).
When plotting a Fibonacci extension for a downtrend, the points are plotted from the high points (0) to the low points (A) and then to the retracement high points (B). The Fibonacci extension is plotted to get the price projection after the retracement (C).
3. Perform the calculation of the Fibonacci retracement, for the levels of: 0.618 and 0.236. Pick a crypto pair of your choice. Show a screenshot and explain the calculation you made.
Calculation of the Fibonacci Retracement
The Fibonacci retracement level can be calculated using the following formula.
Where;
X = Initial value of the price where the retracement start
Y = Max value of the price where the Fib retracement ends.
% Retrace 1 = 23.6%
% Retrace 2 = 38.2%
% Retrace 3 = 50%
% Retrace 4 = 61.8%
% Retrace 5 = 78.6%
Calculating for the 23.6% Retracement Level
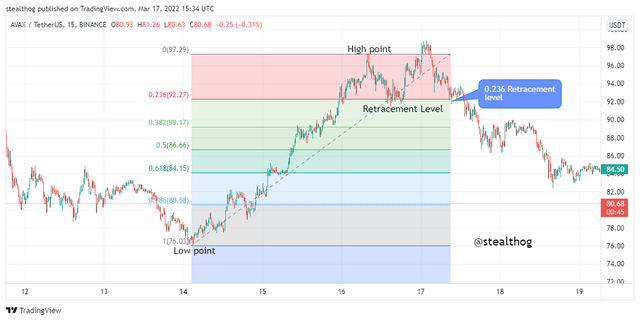
I will be using the AVAXUSDT chart in illustrating this calculation.
The 61.8% retracement level can act as a support level for pullbacks before it continues with the primary trend.
Using the Fib-retracement formula to calculate the retracement for the 61.8% Level.
R1 = X + [(1- % Retrace1/100) * (Y - X)]
Where;
X = 76.03
Y = 97.29
Retrace1 = 23.6%
R1 = 76.03 + [(1 - 0.236) X (97.29 - 76.03)
R1 = 76.03 + [ 0.764 X 21.26 ]
R1 = 76.03 + 16.24
R1 = 92.27
The price was on the 92.27 price level on the chart above.
Calculating for the 61.8% Retracement Level
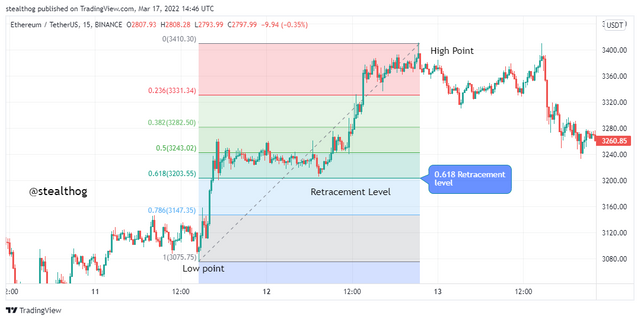
I will be using the ETHUSDT chart in illustrating this calculation.
The 61.8% level can act as a support level for a retracement before it continues with the primary trend.
Using the Fibonacci-retracement formula to calculate the retracement for the 61.8% Level.
R1 = X + [(1- % Retrace4/100) * (Y - X)]
Where;
X = 3075.79
Y = 3410.27
Retrace4 = 61.8%
R4 = 3075.79 + [(1 - 0.618) X (3410.27 - 3075.79)
R4 = 3075.79 + [ 0.382 X 334.48 ]
R4 = 3075.79 + 127.77
R4 = 3203.56 = 3,203.
The price was on the 3,203 price level on the chart above.
4. On a Live account, trade using the Fibonacci retracement, screenshots are required.
I will be using my real account in the Binance exchange platform to execute this trade and the tradingview chart platform to run technical analysis. My Binance account is shown below.

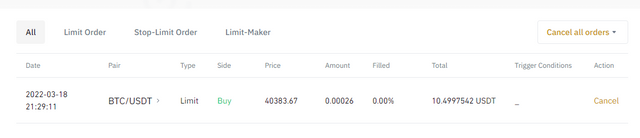
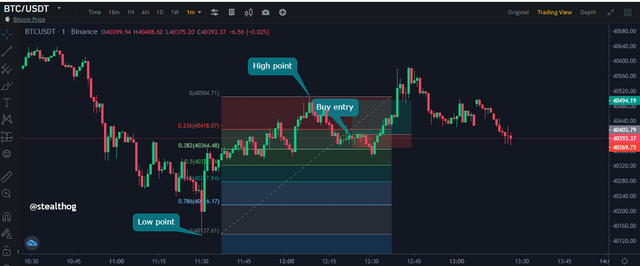
Fibonacci Retracement Buy Order BTCUSDT (Real Trade)
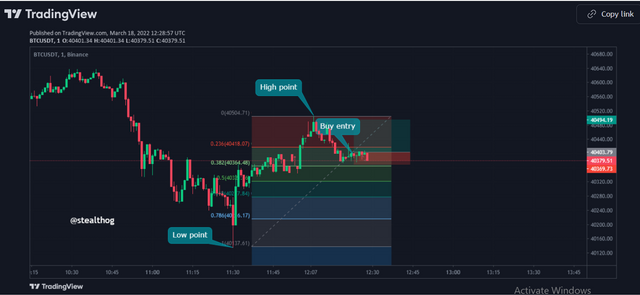
On the chart above, price was in an uptrend with a low point at 40,137.62 and moved to a high point of 40,504.71. Price went for a retracement and bounced off at the 38.2% retracement level. The 38.2% Fibonacci-retracement level acted as a support for retracement. A buy signal was noticed as price bounced off to continue on the primary trend. A risk to reward ratio of 1:2 was used.
Buy order was entered on the Binance account, as shown below.
The technical analysis done using the Fibonacci retracement proved accurate as price went in the uptrend and price meets the take profit level.
5. On a Demo account, make a trade operation using the Fibonacci extension. Screenshots are required.
Buy Order BTCUSDT (Demo Trade)
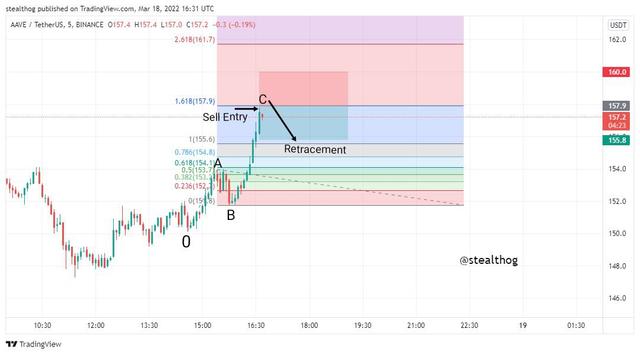
On the chart above, price was in an uptrend. It kept recording higher highs and higher lows. At a previous low marked 0 price hit a new high(marked A). price went for a retracement and recorded a new higher low. The Fibonacci showed the price projection would end at the 1.618 level, acting as resistance. 1.618 level was selected because, at that level, price formed a bearish candle to indicate a trend reversal.
A sell entry order was made on the demo trade as price went for a new retracement. Stop-loss was placed above the resistance level, and a risk to reward ratio of 1:1 was used.
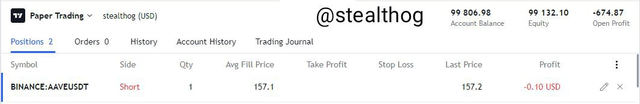
The trade was entered on the tradingview paper trading account.
Conclusion
The Fibonacci number or series have proven to be essential to nature. They have many applications across various fields and aspects of life. In trading, it has been established to be used to identify levels of support and resistance. The Fibonacci-retracement tool and extension tool can predict retracement level and price projection level. Proper risk management should be used when using the Fibonacci tools to predict trade signals.
Thanks, Prof @pelon53, for a fantastic lesson.