[Psychology of Trends Cycle] - Crypto Academy / S6W4- Homework Post for @reminiscence01
Hello Steemians, I hope it's been good for you all. This week prof @reminiscence01 gave a lesson centered on the psychology of trends cycle. It was an exciting read for me, and I will be doing the homework task from the study.

1. Explain your understanding of the Dow Jones Theory. Do you think Dow Jones Theory is Important in technical analysis?
Dow Jones Theory
Dow theory is a concept developed by Charles. H. Dow in the year 1897 as the editor of the Wall Street Journal. Dow stated that all aspects of market activity are discounted by price, including supply, demand, economic news, etc. Dow believed that past price fluctuations influence high and low points in the market. This means that by studying the market movement, a trader can identify the market's direction.
Some tenets make up the Dow Jones theory, and they include;
All market activities and information is discounted in price. An asset price is a collection of all market factors: supply, demand, risks, potentials, etc.
There are three kinds of market trends. The primary market trend is the secondary market trend that is usually retracements or counter-trends to the primary trend and then the relatively market noises of minor trends.
A trend comprises three phases: the accumulation and distribution phase, the public participation phase, and the panic phase.
Volume confirms a trend. This is a phenomenon in which supply and demand affect the trend. There should be an increase in volume when price moves in the trend direction and a decrease in volume when price is in a counter-trend to the primary trend.
Dow Jones theory is essential in technical analysis as the theories are still relevant and valuable in technical analysis.
These principles and more make up the Dow Jones theory, which is the foundation to which modern technical analysis was built. Most technical analysis tools and indicators can trace their working principle to one or more Dow Jones theories. Many indicators analyze past price action in predicting future price action, which is present in Dow theory that current price peaks and troughs result from past price actions.
Also, Dow's theory believes that a trend continues until a clear sign indicates a reversal is a principle on which a technical analysis tool like the market structure is used to predict a trend reversal. An uptrend experiences higher highs and higher lows, while a downtrend experiences lower highs and lower lows. A change in the market structure indicates a trend reversal.
2. In your own words, explain the psychology behind the Accumulation and Distribution phases of the market. (Screenshots required).
The essence of technical analysis is to identify trend and trend reversal points in the market to make profits. It is only wise to understand what triggers the trend and know the different phases in the market.
Accumulation Phase
The accumulation phase is a phase in the market that triggers an uptrend through the actions of big institutional investors or market whales. The accumulation phase is a phase in the market where whales put a significant amount of money into buying an asset that then drives the demand of that asset, which creates an uptrend in the market.
The psychology around the accumulation phase is that in a downtrend where there is high selling pressure, the market whales and big players cash in on some profit, close their sell positions, and start buying the asset. This makes retail traders close their sell positions in loss with the fear of missing the upcoming bullish trend. The public participation (retail traders) adds to the buying volume of the asset, which pushes the trend into an uptrend.
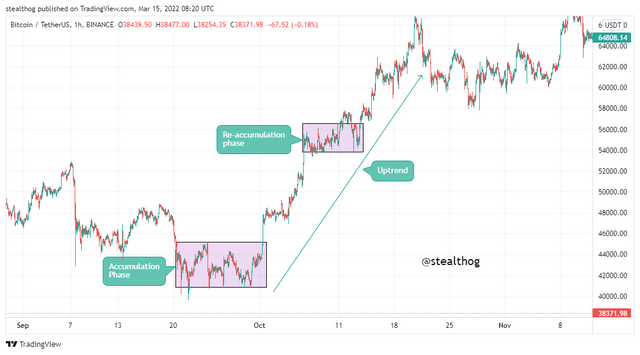
From the chart above, price was in a downtrend. Then it moves to a consolidation state (accumulation phase) as big players have closed their sell positions and taken profit, slowing down price movement due to their high volume. In the accumulation phase, the whales are opening up new buy positions and retail traders panic and are closing their sell positions and opening up more buy positions that drive the price to an uptrend. The re-accumulation phase sees the whales take in some profit and an opportunity for other traders to join in on the bullish trend, and price continues on the uptrend. The re-accumulation phase should not be confused as a trend reversal as long as it does not break the market structure of the trend.
Distribution Phase
The distribution phase is a phase in the market that triggers a downtrend through the actions of big institutional investors or market whales. The distribution phase is a phase in the market where whales take away high volume funds of an asset by selling off their asset that then drives the supply of that asset, which creates a downtrend in the market.
The psychology around the distribution phase is that in an uptrend where there is high buying pressure, the market whales and big players cash in on some profit, close their buy positions, and start to sell off their assets. This makes retail traders close their buy positions with the fear of being caught on the bearish trend reversal. The public participation (retail traders) adds to the asset's selling volume, which pushes the trend into a downtrend.
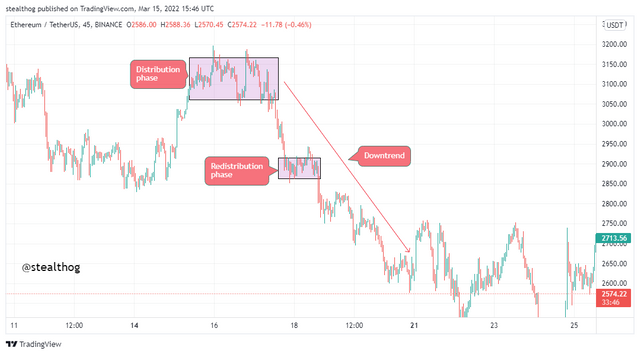
From the chart above, price was in an uptrend. Then it moves to a consolidation state (distribution phase) as big players have closed their buy positions and taken profit, slowing down price movement due to their high volume. On the distribution phase, the whales are opening up new sell positions and retail traders panic and are closing their buy positions as well and opening up more sell positions which drive the price to a downtrend. The redistribution phase sees the whales take in some profit and an opportunity for other traders to join in on the bearish trend, and price continues on the downtrend. The redistribution phase should not be confused as a trend reversal as long as it does not break the market structure of the trend.
3. Explain the 3 phases of the market and how they can be identified on the chart.
There are three phases of the market, as the market can be in an uptrend, a downtrend, or a ranging market. A few techniques can be used in identifying trends that include indicators, trendlines, and market structure. It is advisable not to use indicators as they lag behind price but instead use the market structure in identifying the market phase.
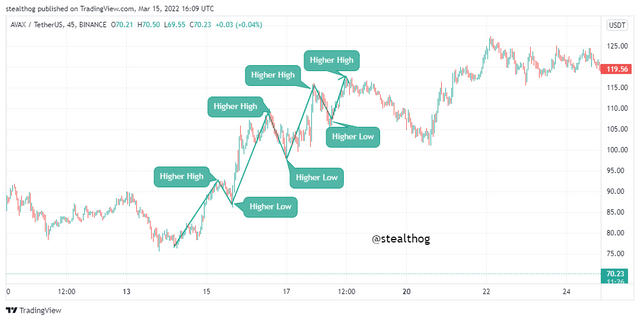
Using Market Structure to Identify an Uptrend
The market structure for an uptrend sees prices creating higher highs on its primary trend and recording higher lows for its counter-trend or retracements. A break in the market structure of an uptrend may be a trend reversal whereby price is unable to record a higher high from the previous high or records a retracement low lower than the previous low.
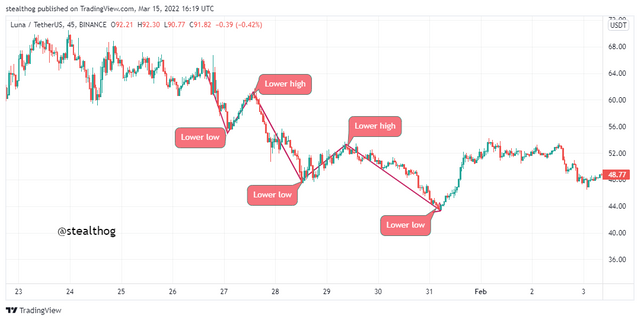
Using Market Structure to Identify a Downtrend
The market structure for a downtrend sees prices creating lower highs on its primary trend and recording lower lows for its counter-trend or retracements. A break in the market structure of a downtrend may be a trend reversal whereby price cannot record a lower high or records a higher high from the previous high or records a retracement low higher than the previous low.
Using Market Structure to Identify a Range
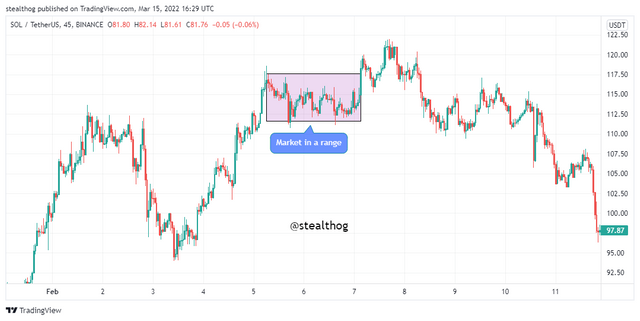
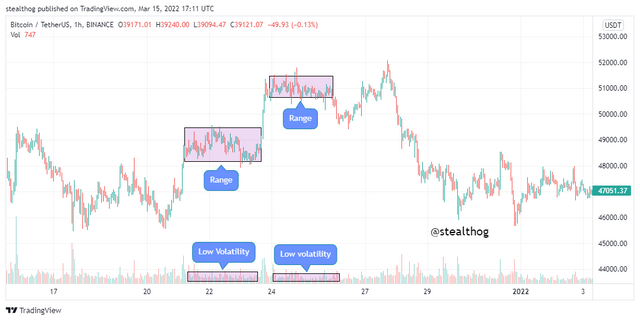
During the accumulation and distribution phases, price goes into a sideways movement or a range. There is a balance in supply and demand during this phase, making prices bounce up and down like in a channel.
The sideways movement of price or when price is in a range is seen at the end of a trend or the middle of a trend during re-accumulation or redistribution. An example of a range is seen below.
4. Explain the importance of the Volume indicator. How does volume confirm a trend? Do this for the 3 phases of the market (Screenshots required).
Volume Indicator
The law of supply and demand affect the direction of price. When there is an inflow of money into an asset or an increase in the buying pressure of an asset, there is an uptrend. Likewise, when there is an increase in the outflow of money from an asset or an increase in the selling pressure, price goes into a downtrend.
The volume indicator shows traders the direction of money flow in or out. Also, the volume indicator indicates an increase in buying pressure, which in turn signifies an increase in demand resulting in an uptrend. An increase in selling pressure increases the supply of the asset, resulting in a downtrend. When the market is in a range, the volume experiences low volatility. The volume is essential as it can be utilized to support trend signals.
Using Volume Indicator to Confirm the Trends
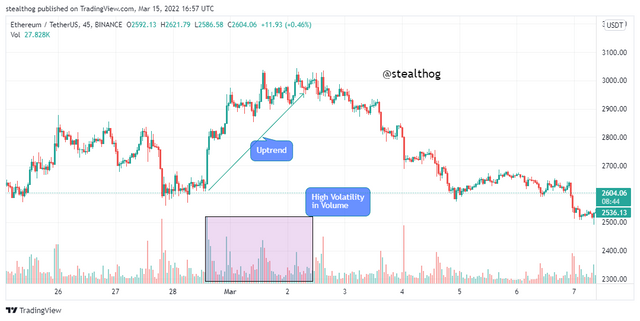
When the market is in an uptrend phase, the volume experiences high volatility as there is also an increase in buying pressure. The uptrend indicates that more traders are buying into the asset, which drives its demand confirmed by high volatility in volume.
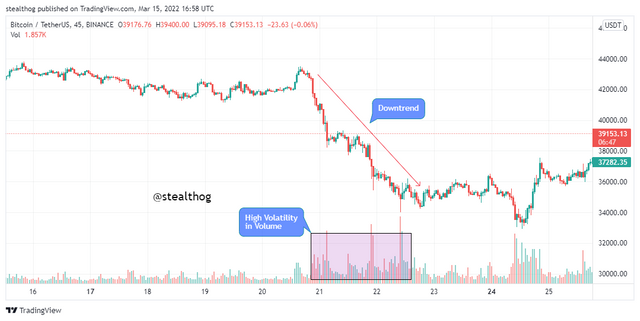
When the market is in a downtrend phase, the volume experiences high volatility as there is also an increase in selling pressure. The downtrend indicates that more traders are selling off the asset, which drives its supply confirmed by high volatility in volume.
There is low volatility in volume when the market moves sideways or is in a range. This is due to an equilibrium in supply and demand or equal buying and selling pressure. This is seen in the distribution and accumulation phases in the market.
The volume has a good correlation with the direction of price.
5. Explain the trade criteria for the three phases of the market. (show screenshots)
Trade Criteria For an Uptrend
The following criteria should be ensured after using the market structure to identify an uptrend before making a buy entry order.
An uptrend recording higher highs and higher lows. With the volume indicator showing high volatility in support of the uptrend
After price makes a retracement or a counter-trend to the primary uptrend creating a new higher low, on its reversal to the primary trend, enter a buy order when a bullish candlestick pattern is formed.
Stop loss is to be placed at the previous low created by the retracement with a risk to reward ratio of 1:1 or 1:2.
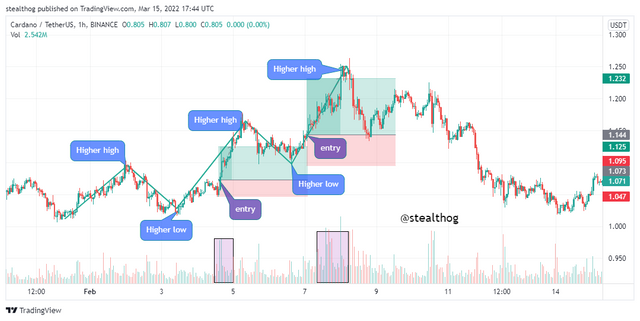
The illustration above shows different entry points in an uptrend that fits the trade criteria. Each of the entry points was supported by a high volatile buying volume.
Trade Criteria For an Downtrend
After using the market structure to identify a downtrend, the following criteria should be ensured before making a sell entry order.
A downtrend recording lower highs and lower lows. With the volume indicator showing high volatility in support of the downtrend
After price makes a retracement or a counter-trend to the primary downtrend creating a new lower low, on its reversal to the primary trend, enter a sell order when a bearish candlestick pattern is formed.
Stop loss is to be placed at the previous low created by the retracement with a risk to reward ratio of 1:1 or 1:2.
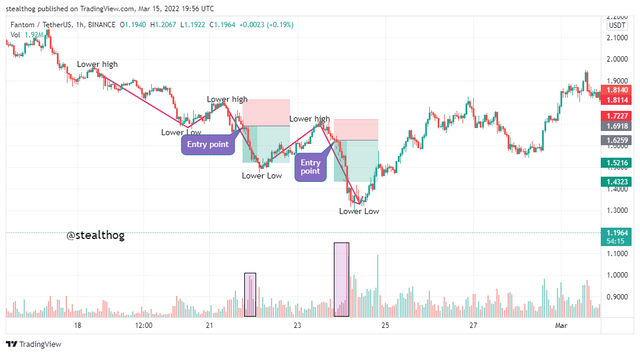
The illustration above shows different entry points in a downtrend that fits the trade criteria. Each of the entry points was supported by a high volatile selling volume.
Trade Criteria For a Range
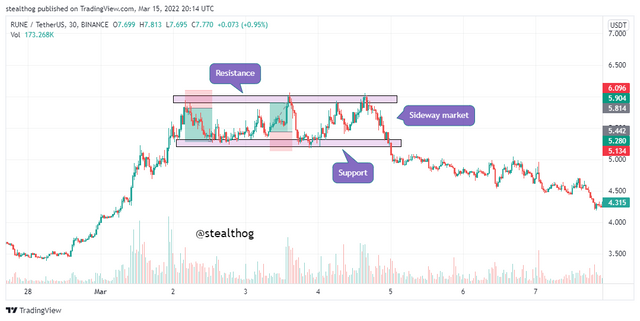
Trading the range or side-way market is not advisable as price can break out at any time and in any direction. It is advised for those who wish to trade the range to use proper risk management. The criteria for trading the range is straightforward and is given below.
Enter a buy order when price bounces from the support zone and a bullish candlestick pattern is formed. Likewise, enter a sell order when price bounces from the resistance zone and a bearish candlestick pattern is formed.
The stop loss for a buy order should be placed below the support zone and take profit at the resistance level, and the stop loss for a sell order should be placed above the resistance level and take profit at the support zone.
6. With the Trade criteria discussed in the previous question, open a demo trade for both Buy/ Sell positions.
For the execution of this task, I will be using the tradingview paper trading platform.
Sell Order
On the LUNAUSDT chart, a downtrend was identified using market structure as it recorded lower highs and lower lows. The volume indicator recorded high volatility in support of the downtrend. As shown below, a counter-trend of the downtrend was reversing back to the primary trend.
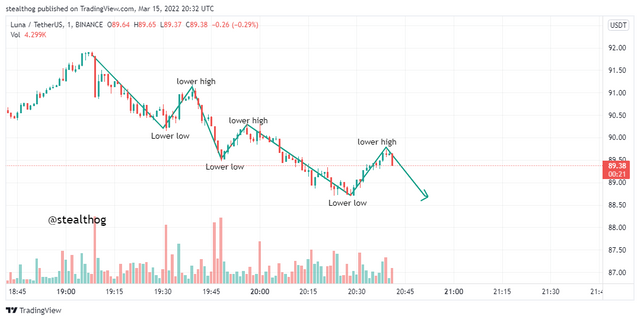
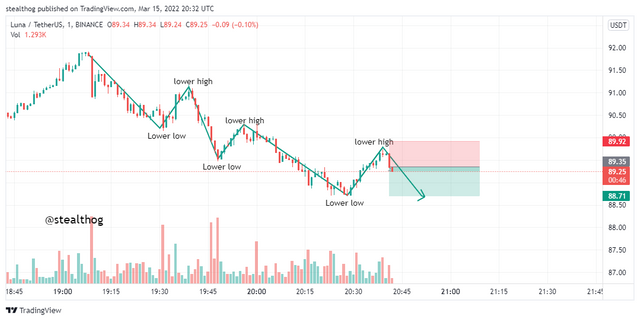
When a bearish reversal candlestick pattern was formed, a sell order was entered with a stop loss placed slightly above the previous high and a risk to reward ratio of 1:1 was used.
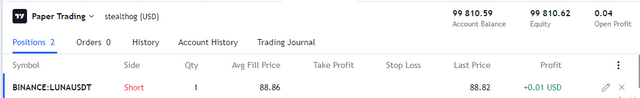
The sell trade was entered on the trading view demo trading platform as shown below.
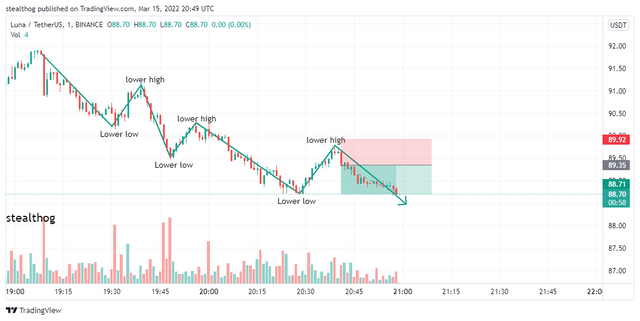
After some minutes, price hit the take profit as the analysis proved accurate.
Buy Order
On the BAKEUSDT chart, an uptrend was identified using market structure as it recorded higher highs and higher lows. The volume indicator recorded high volatility in support of the uptrend. A retracement of the trend was reversing back to the primary trend, as shown below.
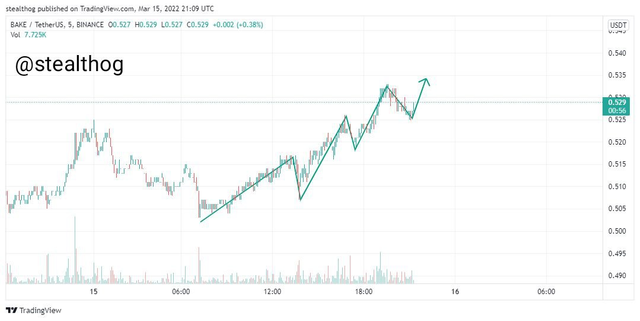
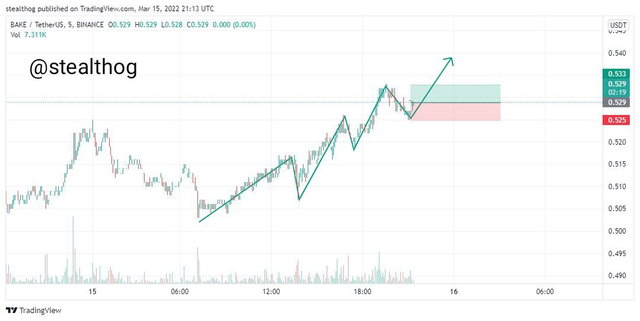
When a bullish reversal candlestick pattern was formed, a buy order was entered with a stop loss placed slightly below the previous low and a risk to reward ratio of 1:1 was used.
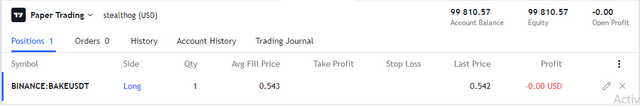
The sell trade was entered on the trading view demo trading platform as shown below.
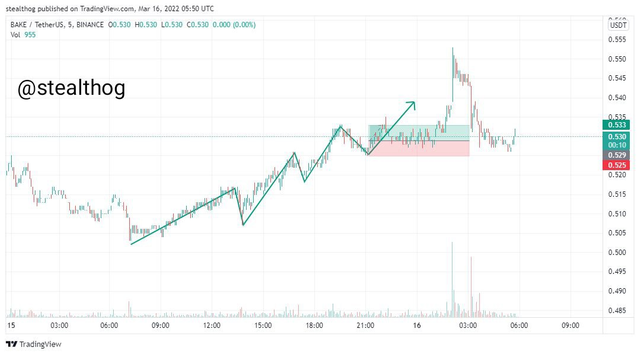
After a while, price hit the take profit as the analysis proved accurate.
Conclusion
Understanding the psychology of the trend cycle when trading goes a long way to ensure a successful trading experience. This is because it helps the trader know when to enter and exit a trade and how the market is being manipulated by the big players and whales so as not to fall prey.
Trading criteria need to be observed when entry trade on any of the three phases of the market. Trading with proper risk management is strongly advised.
Thanks, prof @reminiscence01, for a fantastic lesson.
Hello @stealthog , I’m glad you participated in the 4th week Season 6 at the Steemit Crypto Academy. Your grades in this Homework task are as follows:
Recommendation / Feedback:
Thank you for participating in this homework task.