Steemit Crypto Academy Season 6 Week 4 - Crypto Trading Strategy with Triangular Moving Average (TRIMA) Indicator
Hello Steemians, how are you all doing? I hope you are fine. This week's lesson by prof @fredquantum focused on crypto trading strategy with triangular moving average [TRIMA] indicator. I will be doing the homework task from the study.

1. What is your understanding of the TRIMA indicator?
TRIMA Indicator
Moving averages is a trend-based indicator that follows the behaviour of an asset price. This is done by considering the asset's past price to present its current position in the market, making it a lagging indicator. There have been different modifications to the moving average indicator to counter the lag and market noise issues in the indicator.
The simple moving average is one of the moving average variants that works by taking the average price in a given period. The triangular moving average is the double-smoothed moving average, which provides the indicator with a smooth and wave-like flow, filtering market noise and fluctuations while giving clear market signals.
Like the TRIX indicator, the triple smoothing of the exponential moving average, the TRIMA is the smoothing of the simple average. This reduces its lag effect and quick reaction to price change (which can lead to false or distorted trade signals) to give traders a clear exit and entry points in the market. The TRIMA is a go-to choice for traders trading volatile markets like the crypto market; this helps traders understand the market trend without getting distracted by market noise.
Like most moving averages, the TRIMA moving average can identify current market trends by looking at its interactions with price and their crossovers. An uptrend is determined when the TRIMA indicator line crosses over price and trails upward. A downtrend is identified when the TRIMA indicator line crosses below price and trails downwards.
2. Setup a crypto chart with TRIMA. How is the calculation of TRIMA done? Give an illustration. (Screenshots required).
TRIMA Indicator Chart Setup
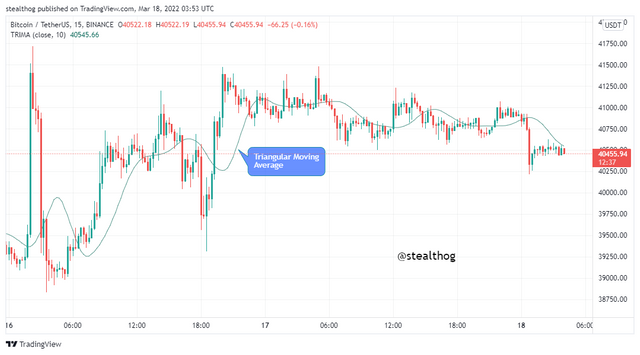
In my illustration of the TRIMA indicator crypto chart setup, I will be using the tradingview.com chart platform. First, I visit the tradingview platform and then select the crypto pair of choice that I will be adding the TRIMA Indicator to.
I selected the BTCUSDT crypto pair; on it, I clicked on the indicator option on the chart and searched for Triangular Moving Average.
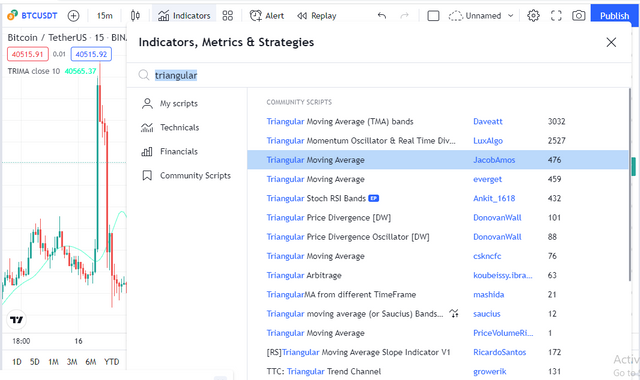
Double click on the Triangular moving average to add to the crypto chart, as shown below.
The settings of the TRIMA indicator can be customized to suit the trading style. The default settings of the TRIMA indicator can be checked by clicking on settings on the indicator menu.
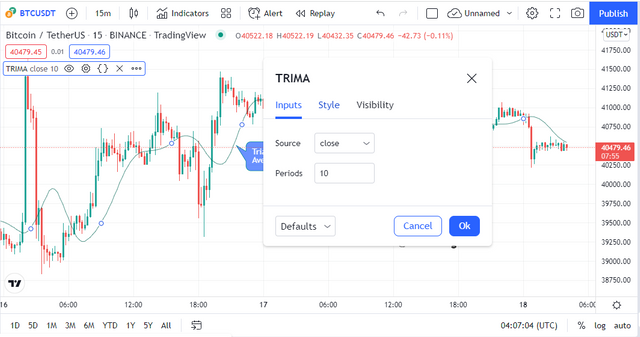
From the image above, the default period of the TRIMA indicator is given as 10
TRIMA Indicator Calculation
The TRIMA indicator is a variant of the simple moving average (SMA) as it smoothes the SMA indicator. In calculating the TRIMA Indicator, the SMA is first calculated.
Where;
P1-5 = Price of the asset at period 1-5
Pn = Price of the asset at the end of the set period
n = Total number of periods in considerations
The TRIMA can now be calculated by further averaging the SMA values.
Illustration
An asset with SMA values over eight periods is given below.
1000, 1100, 1200, 1300, 1400, 1500, 1600, 1700. to calculate the TRIMA, we used the formula
TRIMA = (SMA1 + SMA2 + SMA3 + SMA4 + SMA5 + …. SMAn)/n
TRIMA = (1000 + 1100 + 1200 + 1300 + 1400 + 1500 + 1600 + 1700)/8
TRIMA = 10800 / 8
TRIMA = 1350
3. Identify uptrend and downtrend market conditions using TRIMA on separate charts.
Moving averages are trend-based indicators, and this is no different for the TRIMA indicator. It is used to identify trends in the market with its interaction with price and its angular movement in the direction of the trend. Though it is easy to use to identify current trends, wrong customization of the indicator's settings might make it challenging to detect trends.
Identifying an Uptrend using the TRIMA Indicator
An uptrend can be easily identified with the TRIMA indicator when price crosses above the TRIMA indicator line and trails above it. The TRIMA indicator line trails below price and angles upward in the uptrend direction.
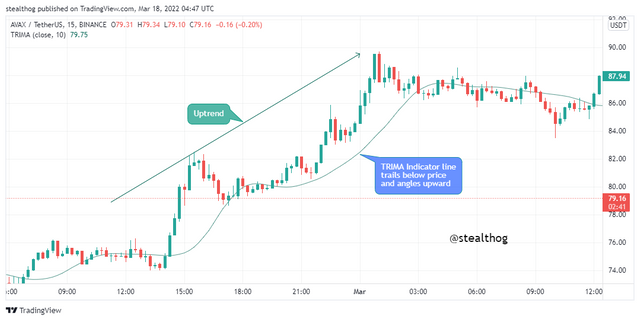
The chart above shows an uptrend as price moved above the TRIMA indicator line. The TRIMA indicator line trailed below, moving in an upward angular direction.
Identifying a Downtrend using the TRIMA Indicator
A downtrend can be easily identified with the TRIMA indicator when price crosses below the TRIMA indicator line and trails below. The TRIMA indicator line trails above price and angles downwards in the downtrend direction.
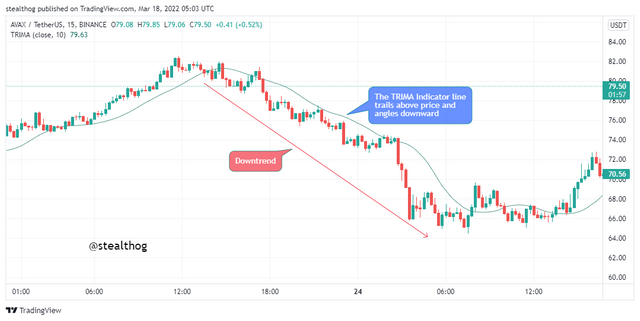
The chart above shows a downtrend as price moved below the TRIMA indicator line. The TRIMA indicator line trailed above, moving in a downward angular direction.
4. With your knowledge of dynamic support and resistance, show TRIMA acting like one. And show TRIMA movement in a consolidating market. (Screenshots required).
Dynamic Support and Resistance Using TRIMA
Support and resistance zones or levels are points in the market where price is rejected from continuing in its current direction or trend. There are different types of support and resistance: horizontal support and resistance, slopping support and resistance, and dynamic support and resistance.
Dynamic support and resistance use oscillating lines, e.g. moving averages that price bounces off to indicate points of support or resistance. The TRIMA indicator line can act as support or resistance when trailing below or above price.
The TRIMA indicator line is dynamic support for price when in an uptrend. When price is making a retracement in an uptrend, the TRIMA indicator line can support it as it bounces off-price to continue the primary trend.
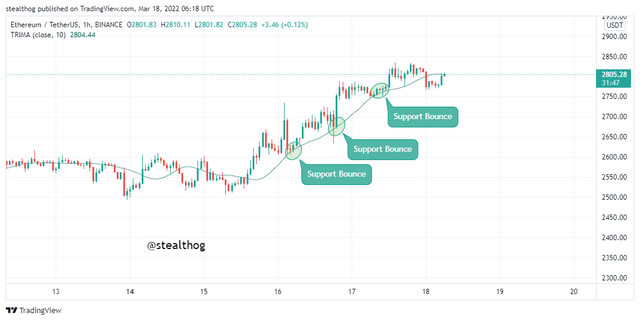
On the chart above, price was in an uptrend and the TRIMA indicator line trails below price. The TRIMA line acted as dynamic support for price on three occasions when price in retracement bounced off the TRIMA line to continue the primary trend.
The TRIMA line also acts as dynamic resistance for price in a downtrend. In a trend, price makes retracement to allow traders to get on the trend at a discounted rate. When in a downtrend and price makes a retracement upward, the TRIMA line can act as a dynamic resistance and bounce price off to continue on the primary trend.
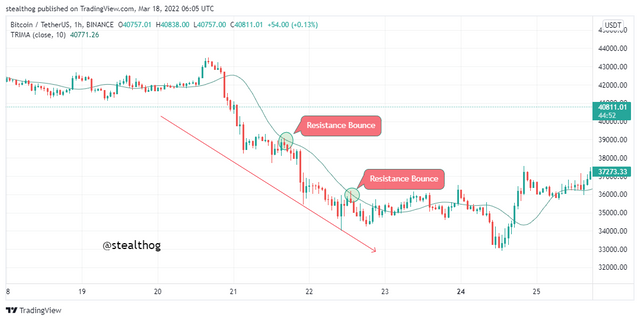
On the chart above, price was moving in a downtrend and the TRIMA indicator line trails above price. The TRIMA line acts as a dynamic resistance for price on two occasions when price in retracement bounced off the TRIMA line to continue on the primary trend.
TRIMA Movement in a Consolidating Market
A consolidating market is a market that moves sideways with no clear trend. A consolidating market happens when there is an equilibrium in buying and selling pressure. Price tends to alternate between a zone of support and resistance as there is a balance of supply and demand and a low volume market.
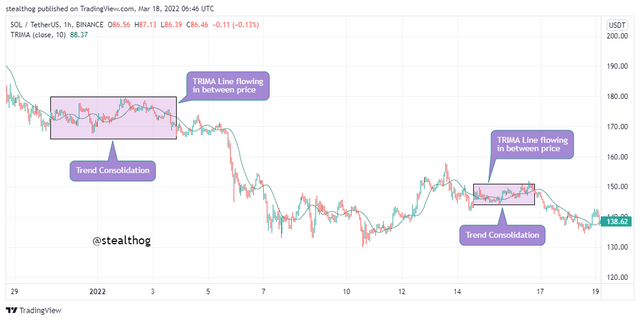
The chart above shows price moved in a sideways direction has price was in consolidation because there was no clear trend. The TRIMA indicator line moved in between prices like an immersion during consolidation in price. The TRIMA line moved in a flat like movement and gave no trading signal.
5. Combine two TRIMAs and indicate how to identify buy/sell positions through crossovers. Note: Use another period combination other than the one used in the lecture, explain your choice of the period. (Screenshots required).
Crossover Strategy Combining Two TRIMAs Indicator
Crossover strategy using moving averages in trading is the phenomenon of moving average lines crossing over each other to give trade signals. The crossover strategy with the TRIMA indicator requires adding two TRIMA indicators with different periods to suit the trading style. Using a shWhen the shorter period TRIMA line crosses over, the longer period TRIMA line gives a buy signal. When the longer period TRIMA line crosses over to the shorter line, it gives a sell signal.
Using a time frame of 45 minutes, a period of 10 and 15 is used for the shorter and longer period TRIMA Indicator. These periods were selected because they react to price better than longer periods for shorter time-frames
Buy Signal Using TRIMA Lines Indicator Crossover
Using the TRIMA indicators lines cross over strategy to give buy signals. The TRIMA line 10 crosses over the 15 TRIMA line to provide a buy signal as it is an uptrend indication. Buy orders can be entered after the crossover.
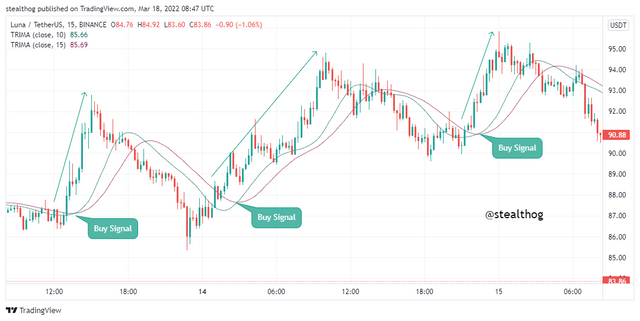
There are a few buy signals on the chart above by the crossover of two TRIMA indicator lines as the TRIMA line 10 (green) crosses over the TRIMA line 15 (red) to give a bullish signal. Proper risk management is advised with stop-loss placed at previous low and a risk to reward ratio of 1:1 or 1:2.
Sell Signal Using TRIMA Lines Indicator Crossover
Using the TRIMA indicators lines cross over strategy to give sell signals. The TRIMA line 10 crosses below the 15 TRIMA line to provide a sell signal as it is a downtrend indication. Sell orders can be entered after the crossover.
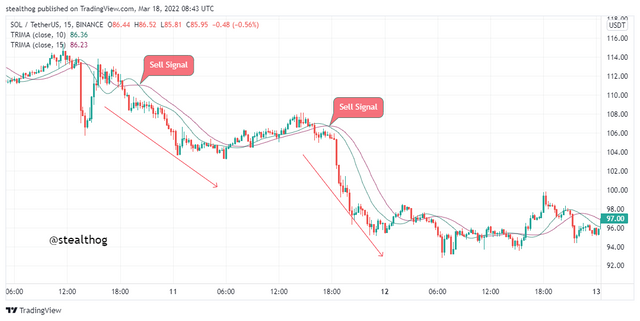
There are a few sell signals on the chart above by the crossover of two TRIMA indicator lines. The TRIMA line 15 (red) crosses over the TRIMA line 10 (green) to give a bearish signal. Proper risk management is advised with stop-loss placed at previous high and a risk to reward ratio of 1:1 or 1:2.
6. What conditions must be satisfied to trade reversals using TRIMA combining RSI? Show the chart analysis. What other momentum indicators can be used to confirm TRIMA crossovers? Show examples on the chart. (Screenshots required).
Trend reversals occur all the time in the financial market. Traders need to predict when a trend reversal happens to enter or exit a trade order to make profits or prevent losses. TRIMA indicator can indicate trend reversal by adding another TRIMA indicator to the chart and for confirmation, paired with other indicators like the RSI indicator. Before making a trade order on trend reversal signals, there are criteria to be observed.
Criteria for Bullish Trend Reversals
Add two TRIMA indicators to the chart, and add the RSI indicator to the chart.
The RSI indicator line moves to the oversold level to give a bullish reversal when price is in a downtrend or a range.
Wait for the shorter period TRIMA to crossover the longer period TRIMA. After the bullish crossover, wait for at least two candlestick confirmations and place a buy entry order.
Use proper risk management by setting up stop loss below the support at the bottom of the crossover, with a risk to reward ratio of 1:1 for beginners.
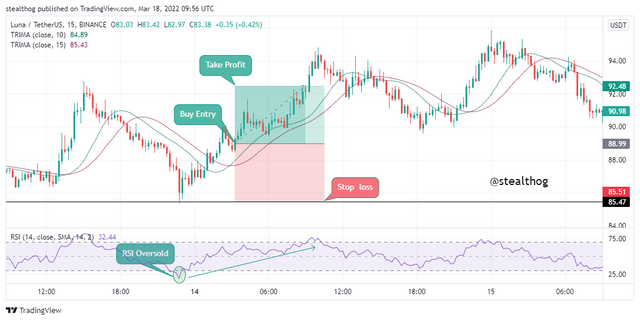
On the chart above, the RSI line moves into the oversold level when it moves below the 25 points level to give a bullish trend reversal signal. The TRIMA 10 line crossed above the TRIMA 15 line to confirm the bullish reversal. Buy order was entered when a bullish candle was formed after the TRIMA lines crossover.
Criteria for Bearish Trend Reversals
Add two TRIMA indicators to the chart, and add the RSI indicator to the chart.
The RSI indicator line moves to the overbought level to give a bearish reversal when price is in an uptrend or a range.
Wait for the longer period TRIMA to crossover the shorter period TRIMA. After the bearish crossover, wait for at least two candlestick confirmations and place a sell entry order.
Use proper risk management by setting up stop loss above the resistance at the top of the crossover, with a risk to reward ratio of 1:1 for beginners.
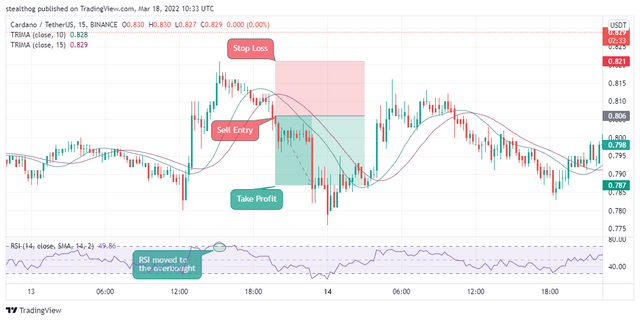
On the chart above, the RSI line moves into the overbought level when it moves above the 75 points level to give a bearish trend reversal signal. The TRIMA 15 line crossed below the TRIMA 10 line to confirm the bearish reversal. A sell order was entered when a bearish candle was formed after the TRIMA lines crossover.
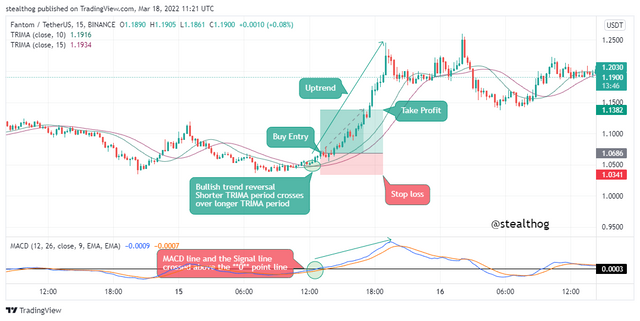
TRIMA paired with MACD
The TRIMA indicator can be paired with the MACD indicator to give and confirm trade signals. The MACD indicator gives trade signals when the MACD line and the signal line cross the 0 level. The MACD line and the signal line crossed above the 0 point level to give the buy signal and crossed below the 0 point level to provide the sell signal.
The MACD crosses above the 0 point level for a buy signal to enter a buy trade. The TRIMA shorter line crosses over the TRIMA longer line to confirm the buy signal. A buy entry is entered when a bullish candle is formed
after at least two candles.
The MACD crosses below the 0 point level for a sell signal to enter a sell trade. The TRIMA longer line crosses over the TRIMA shorter line to confirm the sell signal. A sell entry is entered when a bullish candle is formed after at least two candles.
7. Place a Demo and Real trade using the TRIMA reversal trading strategy (combine RSI). Ideally, bullish and bearish reversals. Utilize lower time frames with proper risk management. (Screenshots required).
Real Trade Buy Signal
I will be using my real account in the Binance exchange platform on executing this trade. The image below shows the screenshot of my verified account.

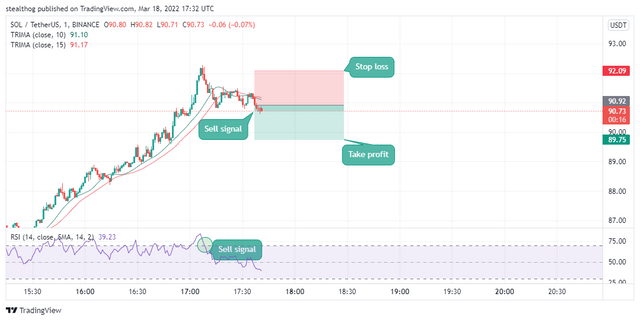
On the SOLUSDT trade, price was in an uptrend creating higher highs and higher lows. Price had a trend reversal, and a sell signal was given when the RSI line crossed to the overbought zone to provide a bearish trend reversal. The bearish trend reversal was confirmed when the longer TRIMA 15 line crossed over the shorter TRIMA 10 line to confirm the sell signal.
A sell entry order was entered when a bearish candle was formed. Stop-loss was placed above previous resistance, and a risk to reward ratio of 1:1 was used.
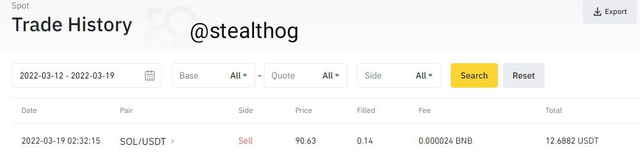
The real trade was entered on the Binance exchange platform. The sell trade history is shown below.
Demo Trade
I will be using the tradingview paper trading account to execute this trade.
On the RUNEUSDT trade, price had a trend reversal, and a buy signal was given when the RSI line crossed to the 50 point zone to give a bullish signal. The bullish trend reversal was confirmed when the shorter TRIMA 10 line crossed over the longer TRIMA 15 line to confirm the buy signal.
A buy entry order was entered when a bullish candle was formed. Stop-loss was placed below previous support, and a risk to reward ratio of 1:1 was used.
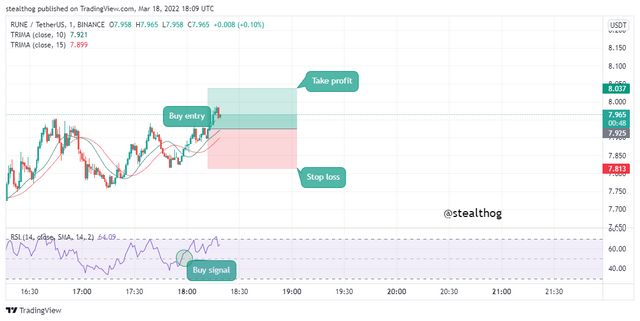
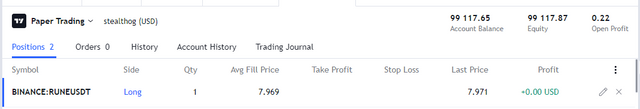
The demo trade was entered on the tradingview paper trading platform. The buy trade is shown below.
8. What are the advantages and disadvantages of TRIMA Indicator?
Advantages of TRIMA Indicator
The TRIMA indicator helps reduce market noise. Due to its double smoothed nature, it does not react to small price fluctuations.
The TRIMA indicator gives trade signals through the crossovers of two TRIMA indicators with different period settings. Usually paired with a momentum indicator like the RSI
The TRIMA indicator acts as dynamic support and resistance level for price.
Due to the double-smoothing of the TRIMA Indicator, the TRIMA indicator gives more accurate trade signals.
Disadvantages of TRIMA indicator.
It is a trend-based indicator and, on its own, do not give trade signals.
In a ranging market, the TRIMA indicators flows in between price in a flat line and do not give any trade signal
Conclusion
TRIMA indicator is a variant of the simple moving average. It is a smoothed version of the SMA. The TRIMA indicator is a trend-based indicator that monitors price and filters market noise and price fluctuation to represent price current position. The TRIMA indicator gives trade signals using crossovers strategy with another TRIMA indicator of a shorter or longer period.
Thanks, prof @fredquantum, for a fantastic lesson.