[Support and Resistance Breakouts] - Crypto Academy / S6W3 - Homework post for professor @pelon53.
Hello Steemians, it's been a good week for me. I hope it's been good for you also. This week prof @pelon53 gave a lesson centred on support and resistance breakouts. I will be performing the homework tasks from the study.

1. Explain in detail the advantages of locating support and resistance on a chart before trading.
One of the fundamental technical analysis skills to have is identifying support and resistance zones. The support and resistance zones are critical levels in the market where potential trade points exist. Some of the advantages of locating support and resistance zones in the chart include;
- Entry and Exit Points
The support and resistance zones are always potential entry and exit points in the market. If there is a breakout of the support or resistance level, it is seen as a trade signal to enter or exit a trade order. Also, if price gets bounced off at the level, it is a trend reversal signal, and scalp traders may benefit from it.
- Increase Zone Liquidity
The liquidity of the market is increased on levels of support and resistance. Many traders see the support and resistance level as potential swing points in the market and place trade orders on the zone to sell or buy. The increased orders on the support and resistance zone mean that liquidity of the asset or market tends to increase.
- Good Confluence Trading Tool
The support and resistance tools are good technical analysis tools for confluence trading as they can help confirm signals from other technical analysis tools or indicators. As stated earlier, the support and resistance zones at historical levels are key swing points. Trade signals confirmed by the support and resistance zones are highly accurate.
2. Explain in your own words the breaking of supports and resistances, show screenshots for the breaking of a resistance, use another indicator as a filter.
Breaking of Support and Resistance
The breaking of support and resistance or better known as breakouts. Breakout is when price rallies past either of the zones (support and resistance) to continue the preceding trend or create a trend reversal. Support and resistance zones act as the floor and ceiling in the market where price bounces off and sometimes make a range. Breakouts occur when price can move past these zones either in the bid to continue the initial market trend or to change direction and create a trend reversal. Retest occurs in breakouts when price goes back to the broken zone (support or resistance) for a retest.
Breaking of a Resistance zone
Resistance zones are zones in the market where price bounces off downwards. When price is in an uptrend and gets to a resistance zone, it gets rejected, and a downtrend begins. A resistance breakout indicates that price has broken past the resistance zone and moved upward.
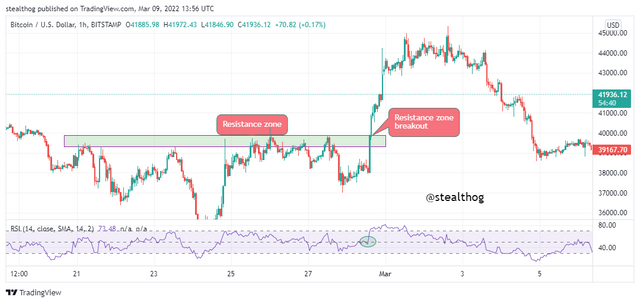
From the chart above, a horizontal resistance zone was identified and drawn. Price tested the area several times on the resistance zone and got rejected. On another test to the resistance zone, price rallied past the zone and created a breakout. The RSI indicator confirm the breakout as the RSI line crossed the 50 point level to indicate an uptrend. Price rallied past the resistance zone and continued without retesting the level.
In some cases, when price breaks a resistance zone, it comes back for a retest called a pullback.
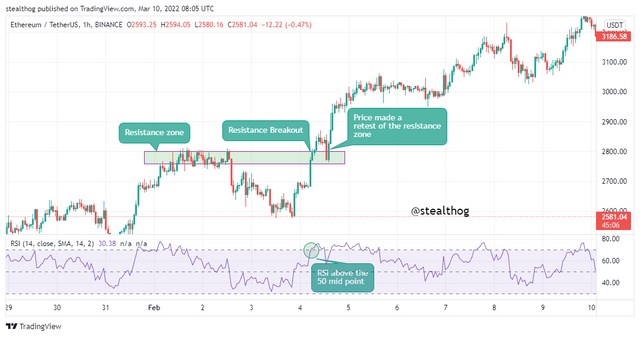
The chart above showed a resistance zone where price got rejected due to a consolidation of price. The price tested the level, broke the resistance, and rallied in an uptrend. Price made a pullback, retested the resistance zone, and got rejected as resistance turned support. The rsi indicator was used as confirmation as the RSI line was above the 50 point level.

3. Show and explain the break of a support, use an additional indicator as a filter, show screenshots.
Breaking of a Support Zone
The support zone acts as a floor in the market that bounces price off when in a downtrend, and most traders use the zone as a trade signal for an eventual trend reversal. In some cases, an increase in selling pressure sees price breaks the support zone, and in such cases, a support breakout has occurred.
Support breakout can happen in two forms. The first is when price breaks the support zone and continues in the preceding trend, as shown below.
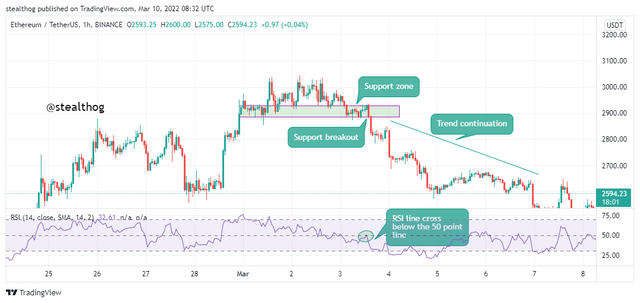
A support zone was identified from the chart above when price was seen to have tested a particular level severally on the market and got bounced off. On another test of price by the market, increased sell pressure sees price break the support level and continue on the downtrend. The RSI line crossed below the 50 point level to confirm the breakout as the cross below the 50 point line indicates an increase in selling pressure.
The second kind of support breakout happens when price rallies past the support zone level and returns for a retest or experiences a pullback before continuing on the downtrend. An example is given below.
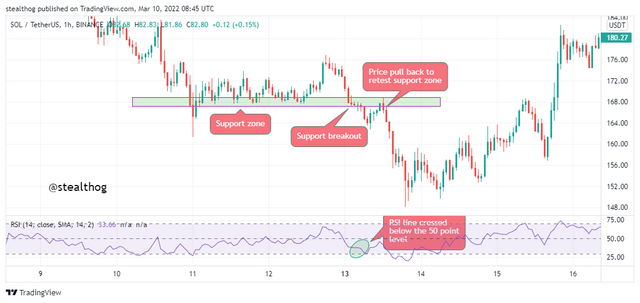
From the chart above, price experienced consolidation as the support zone was tested severally. The RSI indicator indicates an increase in selling pressure as the RSI line crossed below the 50 point level; this saw price break the support zone. Price experienced a pullback and came for a retest of the zone but got rejected, and it continued on the downtrend.
4. Explain what a false breakout is and how to avoid trading at that time. Show screenshots.
False breakouts occur in support and resistance levels, whereby price breaks the zones but fails to continue the trend when a pullback happens. This might be due to the market searching for liquidity or higher trading pressure (buyers or sellers) going against the breakout and pulling price back to the zone. A false breakout occurs both in support and at a resistance level.
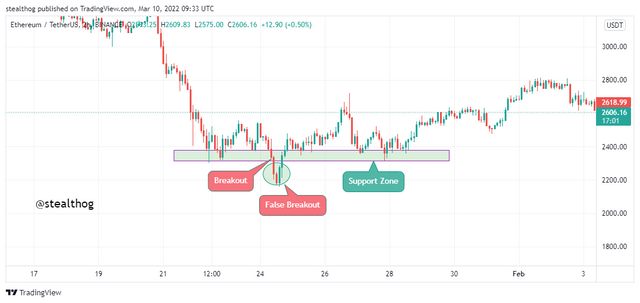
A false breakout from a support zone is shown in the chart above. Price tested the support zone twice and got rejected. On its third test of the support zone, it rallied past the support zone creating a breakout. But on its retest of the support zone, it was pulled back immediately by an increased buying pressure and continued trailing above the support zone as it was unable to break it.
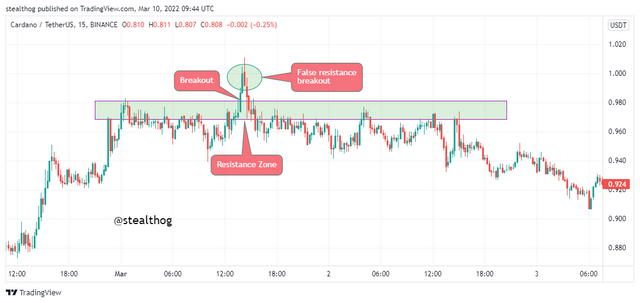
Another example of a false breakout is when price trailed on a resistance level and was unable to break it. An increase in buying pressure sees price break the resistance zone. But like in the case of the false support breakout, price was pulled back to the resistance zone by increased selling pressure. The attempt to break out from the resistance zone failed as price continued to trail below the resistance level as it was unable to break it.
Traders who trade using the support and resistance breakout strategy may experience loss of funds due to false breakouts as trade orders might have been entered from the initial breakout. There are a few ways to avoid trading a false breakout given below.
Filter trade signals given by the breakout strategy with other indicators like RSI and Volume indicator. Combining other indicators helps prevent trading on false breakouts signals.
it is advisable to wait for the close of 2-3 candles before entering a trade order, or for more cautious traders, wait for a retest and continuation of trend before entering a trade.
5. On a demo account, execute a trade when there is a resistance breakout, do your analysis. Screenshots are required.
Buy Order Using Trade Signal from a Resistance Breakout
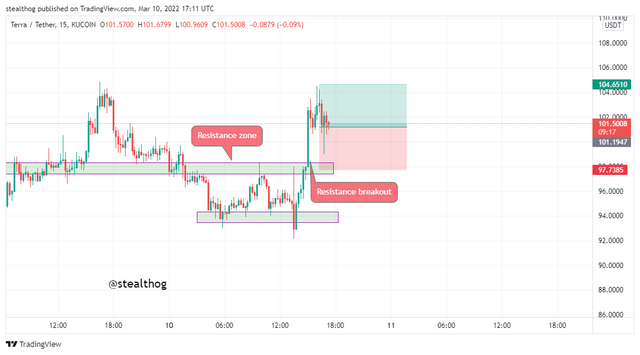
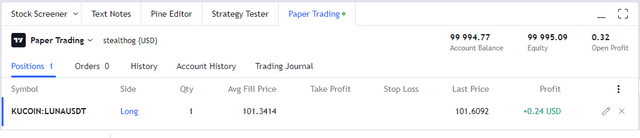
Buy order was initiated on the tradingview demo trading account when a resistance breakout occurred on the LUNAUSDT 15 minutes chart. A support zone that turned resistance was identified on the LUNAUSDT chart as price tested the resistance level and got rejected. A resistance breakout occurred on a second test by price as price rallied past the resistance zone and continued in an uptrend.
After waiting to see if price would retest the zone and there was no pullback, I entered a buy order setting my stop loss on the resistance zone and used risk to reward ratio of 1. The trade was in profit as of this writing.
6. In a demo account, execute a trade when there is a support break, do your analysis. Screenshots are required.
Sell Order Using Trade Signal from a Support Breakout
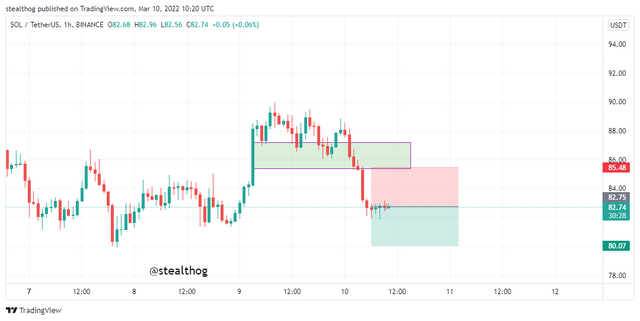
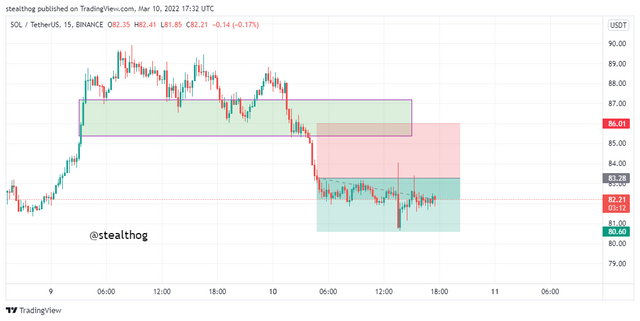
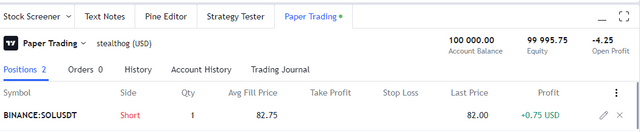
A sell order was initiated on the tradingview demo trading account when a support breakout occurred on the SOLUSDT 15 minutes chart. A support zone was identified on the SOLUSDT chart above as price tested the support level and got rejected severally. On another test by price, a support breakout occurred as price rallied past the support zone and continued in a downtrend.
After waiting to see if price would retest the zone and there was no pullback, I entered a sell order setting my stop loss on the support zone and used risk to reward ratio of 1. The trade was in profit as of this writing.
Conclusion
Support and resistance are swing points in the market where price trend gets reversed. On occasion, price back with an increased trading pressure breaks out of these zones and continue on the current trend. A breakout of the support and resistance zone is seen as an entry/exit point in the market. It is advisable to ensure the breakout success before initiating a trade order as there are instances of false breakout where price fails to continue the trend and gets pulled back to the zone.
Thanks to prof @pelon53 for an exciting lesson.