Steemit Crypto Academy | Why Technical knowledge is Important in Trading and How To Read, Understand The Technical Chart?


Hello All,
Hope you all are doing well. My self @stream4u, I am one of your crypto professors, welcome you all to my class.
In this class and through my lecture, you will come to know about the importance of Technical knowledge as to why it is important in trading.
Let's begin our class.
Before I start to explain what is Technical knowledge and why it is needed, let me ask you on what basis you invest your money in crypto coin, the most common answer will get on this like;
- Just because of a friend brought.
- Just because a friend has and he is in good profit.
- Just because of Coin running up.
- Just because of crypto trending in a market.
Another question let me ask you, after investment in the crypto how many peoples are in profit, I am sure not all people, and most common will be like;
- Not in profit and still holding.
- Sell coins due to loss.
- Holding since last one or couple of years but trade is in negative.
We also experienced that sometime after selling trade, holding a coin in loss later some time the coin went up and you thought why do I sell early.
So basically and to be very frank, everyone here is trying to make money from the money. Investment always come up with the Risk.
Crypto Market Is A Dynamic Market, Here Anything Can Possible At Any Time, So How We Can work And Invest Safely, Let's See.
| Here, Technical knowledge will guide and help you to understand the market, price movement, price action, and once you understand the market, price movement, and price action you will come to know at what time and in which coin you can do an investment, not only this it will also let you know when you need to exit from the market to avoid more losses or book the profit. |
If we do not know the technical concept then there are possibilities that we may get trapped into the bullish trend or square off trade early in the loss. Without having a technical concept we enter and exit any time and end up with a loss.
The Technical part is actually very vast, but following a few points we can get a good trade and we can avoid huge losses.
Any type of trading offers the great possibility of financial freedom but is fraught with danger. There is money to be made, but equally, there is also money to be lost! Therefore, you need to consider what is needed to trade successfully.
So how to avoid losses.
Technical analysis is a trading discipline employed to evaluate investments and identify trading opportunities by analyzing statistical trends gathered from trading activity, such as price movement.
Technical analysis makes use of charts to study the past movement of prices in an attempt to anticipate the probable future movement of that asset price.
In other words, technical analysis uses an asset's historical price, namely its open, close, high, and low prices, as well as its volume data to construct an assets chart to determine which direction the assets should take, based on its past data.
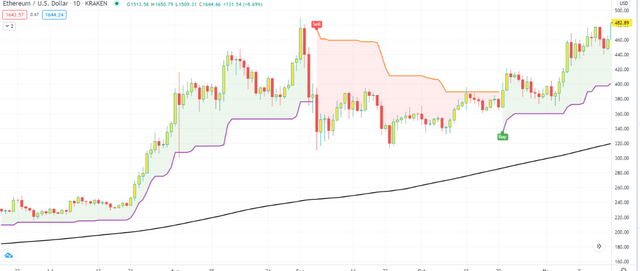
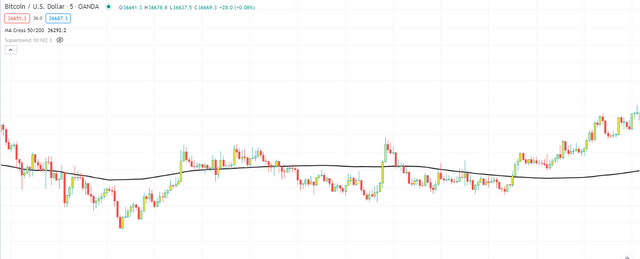 Chart Example From TradingView
Charts are the foundation of technical analysis. They are a graphical representation of the historical price movement of assets and make the recognition of chart patterns possible. There are different types of charts that can be used in technical analysis. We will be going to learn about Candlestick Charts.
Key Points In Technical Analysis?
Technical analysts, also known as chartists, employ technical analysis in their trading and research.
Technical analysis looks for price patterns and trends based on historical performance to identify signals based on market sentiment and psychology.
What is Candlestick Charts?
It is actually known as Japanese candlestick charts. Candlestick charts provide information like open price, high price, low price, and close price, however, candlestick charting also provide a visual indication of market psychology, market sentiment, and potential weakness.
Basically, there are two types of candles we see in the Candlestick charts.
- Dark Candle: Indicate Bear sign which means a down price.
- Light Candle: Indicate Bull sign which means up price
The Dark candle mostly sees in Red and the light candle sees in Green, but you can give any dark and light color.
So the market moves in two directions, up and down which mean bullish and bearish.
Now, here if I ask you when you wanted to invest your money or simply you wanted to buy a coin, which side you will prefer? I am sure if you are going to buy then you will not enter into the downside market which means in the bear market.
Now, how to understand the downside and upside by reading the candle chart. First check below two candles for an example, what you can see in this?
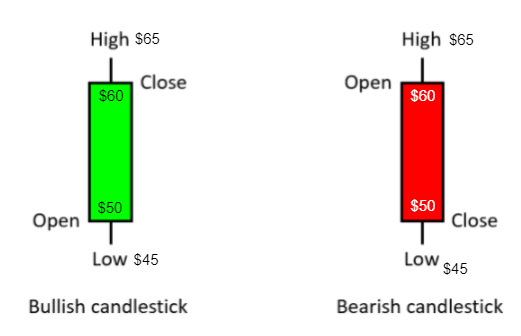
What above two candles are trying to show? The Basic information is below.
Light/Green Candle: Coin Price open at $50, made low $45, made high $65 and closed at $60.
Dark/Red Candle: Coin Price open at $60, made high $65, made low $45, and closed at $50.
According to the above two candles and by adding such multiple candles we can find we can see how the market is moving.
We will learn and understand this concept as simply as possible.
Here first we simply look at the chart of any one of the coins in which you would like to enter/invest & then second and very important is to understand its price movement. We Will Not Enter Blindly.
As I said, understand about its price movement, so what exactly we need to find into the Chart, we will see this with the example.
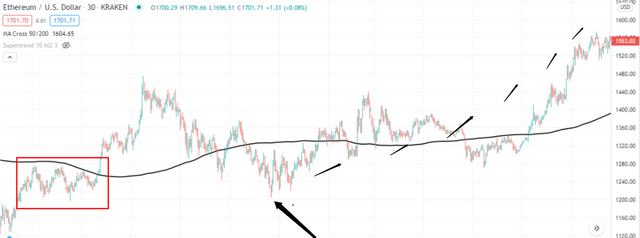
So for example, I am taking random a piece of the chart of Ethereum, below is the same, look at the chart and see what we can see in the chart.
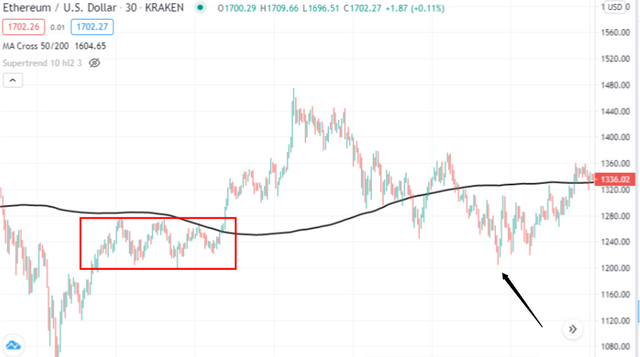
So what we can see in this chart if I see at the box side, so I can see that the Ethereum price was around 1200 then pump little and go to near around 1280, from here its go down again to around 1200 then pump again and again go to 1280, then again come at near 1200, here it got spiked and also crossed 1280, reaches to around 1480................... Can we say there is something at level 1200 which trying to pump the price?
Now after spiked, later on, the price came down again to the same level which is around 1200(look at the arrow), again from the same level it pumped and go up.
Now, from this example can I ask you, at which level you would like to buy Ethereum, 1200 or 1280 or 1400, which price you feel safe and low risk.
See below what happened next in Ethereum.
What we learn in a chart reading:-
- From which level of price the coin pumped means go up.
- From which level of price the coin came down.
We will stop here, I am sure you got some interest in this now. If you have any concerns, doubts, questions on this first topic, you can ask me in the comment section below.
There are more concepts I will be going to cover in my upcoming topics in Crypto Academy.
In this topic, I have tried to cover basic things about technical knowledge which is required first before understand the next topics.
If you really like to go further in this then I would like to give you a Homework Task on this first topic and you need to make a post on this task.
Homework Task
The task will be simple, you need to make a post and explain it in your words. The subject and points are given below that you need to cover in your homework task. The points are not limited, you can add more but make sure it is relevant to this topic.
Task Subject: Why Technical knowledge is Important in Crypto Trading?
- What is the role of a Technical chart?
- Why do you think Technical knowledge is important.
- Uptrend or downtrend, which one is good for buy a coin, explain why?
- Check any Crypto Coin technical chart and explain what you find/understood from the Chart with screenshots.
The homework task posts require a minimum of 300 words.
Add tag #technicalcrypto in post.
Kindly submit your homework task before 14th February 2021.
Thank You.
@stream4u
Crypto Professors : Steemit Crypto Academy
Here is my entry sir
https://steemit.com/hive-108451/@simonnwigwe/why-technical-knowledge-is-important-in-crypto-trading-homework-submitted-by-simonnwigwe
Verified Already.
Thanks for promoting Steem by sharing you post on twitter
( If you no longer want to receive notifications and upvotes from us, reply to this comment with the word
STOP)Thank you for giving us this precious knowledge. I'm looking forward to do my First crypto Homework :)
Thank You.
@akkibadboy
Moderator: Steeming India Community
#india #affable #cryptoprofessors #homework
===========================
@stream4u
Can you please explain this picture???
The Basic information is below.
Light/Green Candle: Coin Price open at $50, made low $45, made high $65 and closed at $60.
Dark/Red Candle: Coin Price open at $60, made high $65, made low $45, and closed at $50.
The detailed information on this will be going to cover in next topics.
Thank You.
@stream4u
Crypto Professors : Steemit Crypto Academy
#india #affable
@stream4u
My Task: https://steemit.com/hive-108451/@boss75/homework-task-1-or-or-why-technical-knowledge-is-important-in-trading-and-how-to-read-understand-the-technical-chart-by-stream4u
Congratulations, your post has been upvoted by @dsc-r2cornell, which is the curating account for @R2cornell's Discord Community.
Enhorabuena, su "post" ha sido "up-voted" por @dsc-r2cornell, que es la "cuenta curating" de la Comunidad de la Discordia de @R2cornell.
Great work! Nicely explained 👏🏻

@ghostfacer99
Member: Steeming India Community
Благодарю вас за пост, технический анализ очень важный аспект для торговли.
О точках входа и выхода вы расскажете в следующем посте? Мне было бы очень полезно прочитать об этом.
As per google translator I understand, you are trying to say;
Yes, in the next coming topics I will be going to explain each and everything about entry, exit, stop loss, targets. But, for that this information is required.
If you really like to go on this, then I will request you to understand this post and try to complete the homework, so that we can proceed further.
Thank You for showing your interest to learn from this post.
Thank You.
@stream4u
Crypto Professors : Steemit Crypto Academy
#india #affable
Да, я обязательно сделаю домашнее задание. Мне очень важны знания рынка криптоактива. Спасибо за ваш ответ
Thank You @stream4u,
Helping us to understand technical knowledge in trading 👏
🍻Cheers
Lets Connect👉🏻@y0gi
Steeming India Community: (Member)
#india #steemit #affable #Steem #twoprecent
I liked the concept of candles and i used to find charts scary, but this article of yours has simplified the concept.
Thank you
#onepercent #india #affable
Thank you, there are more I will be explaining in the coming topics and I am trying to explain in very easy way so that everyone can understand.
If you really like this concept then you can take a part in the homework task, will like to see the homework task on the mentioned topic and points.
Thank You.
@stream4u
Crypto Professors : Steemit Crypto Academy
#india #affable
I really liked and I'll participate soon.
Thank You For To Support Steemit Crypto Academy.
@stream4u, here is my entry .
https://steemit.com/hive-108451/@talktofaith/why-technical-knowledge-is-important-in-crypto-trading-or-or-home-work-submitted-by-talktofaith-100-power-up
Verified, Thank You For Showing Your Intrest to learn Crypto Trading Technical knowledge and support Steemit Crypto Academy.
Thank You.
@stream4u
Crypto Professors : Steemit Crypto Academy
#india #affable