Trading Strategy with Median Indicator - Steemit Crypto Academy |S6W4| - Homework Post for Professor @abdu.navi03
Hello, my name is Wasim. I hope everyone will be fine.
I'm going to work on the homework for the fourth week of season 6 at the Stemate Crypto Academy.
Today in this homework we will talk with Median Indicator about another trading strategy.
There are many trade indicators, one of which is the median indicator.
Today I will make a post on Professor @ abdu.navi03's tutorial on Median Indicator.
Thanks to @ abdu.navi03.
QUESTION OF MEDIAN INDICATOR
1-Explain your understanding with the median indicator.
2-Parameters and Calculations of Median indicator. (Screenshot required)
3-Uptrend from Median indicator (screenshot required)
4-Downtrend from Median Indicator (screenshot required)
5-Identifying fake Signals with Median indicator(screenshot required)
6-Open two demo trades, long and short, with the help of a median indicator or combination that includes a median indicator (screenshot required)


1-Explain your understanding with the median indicator.
Median indicators Moving Average, Hacken Asian, etc. are technical indicators that point to the correct trend of the market.
The median indicator is a trend indicator that is used to better identify a market trend than other indicators.
In addition, we have MA and EMA indicators that indicate the correct entry points and external points, but the median indicator works much better.
MA and EMA also produce false signals which can be easily detected with the help of median indicator.
The median indicator works differently from any other indicator because the indicator uses ATR from the median line
To make the median indicator easier to understand, it produces a color buy and sell signal.
It forms a green median line called Moving Average, from which we can easily locate entrances and exits.
The green median line signals the market up trend and the purple median line signals the market down trend.
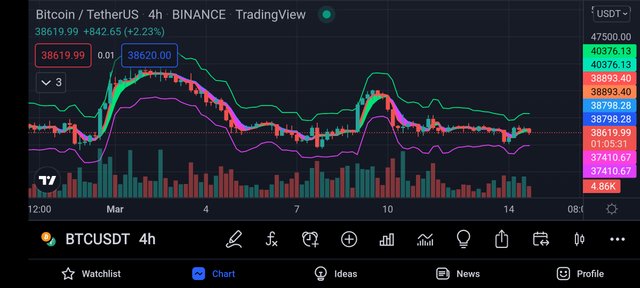
Source Tradingview.com
2-Parameters and Calculations of Median indicator. (Screenshot required)
Parameters of Median Indicator
I will use the tradingview mobile application to specify the parameters of the median indicator
With the help of this mobile application we can easily check the indicator and also we can see the parameters, length, time frame and other information in it.
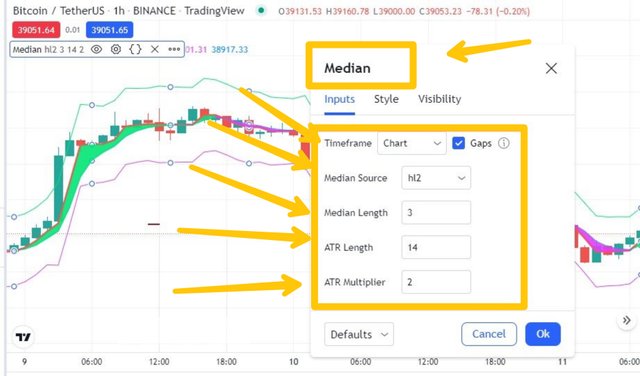
- Time frame.
Timeframe Chart This is a parameter that the trader chooses the timeframe according to his need. We can select any timeframe from the chart, for example from one minute to one year or in any timeframe. Create charts
Median source
HT2 is set in the default setting
Different parameters have to be selected for Open High Low Close Relevant SourceMedian length
A parameter that acts as a familiar option in an indicator is analyzed by selecting its relative length
- ATR length and ATR multiplier.
ATR Length and ATR Multiplier are parameters that play an important role in searching through median indicator settings.
When the median ATR is calculated, the 14 start is automatically written. ATR multiplication = The value ATR is multiplied by ATR in the formation of upper and lower bands. 2 Defaults This is important in business
Calculations of Median Indicator
- This is not like the general average.
It takes very similar settings for a certain period of time and the price of the market starts and ends.
It also shows the ups and downs in any time frame.
The median indicator works differently from all other indicators and it is an advanced type and it consists of ATR multiplier.
To see the median value, we have to look at the average value of the value, for which we have to add the highest and the lowest value and divide by 2. That would be the calculation of a candle
If we want to calculate the value of EMA, we need a candle
The closing price and the average value of the previous day will be required which will be multiplied
The indicator will be used to calculate the ATR value and will be divided by the timeframe as required.
3۔Uptrend from Median indicator (screenshot required)
Median indicator is one such period
Find out where the market is moving upwards ie the median line is green and constantly moving upwards. In this era Uptrend can be well defined.
median indicator
is a Trend Based indicator.
Which better reflects the volatility of the market.
When the market shows a bullish trend, the median line appears above the EMA and when the median line appears below the EMA, it shows a bearish trend and the median line appears purple.
As seen in the screenshot below
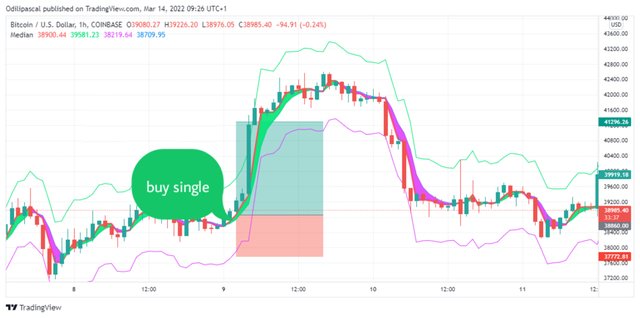
In the screenshot we can clearly see the green indicator indicating the purchase.
Median indicator predicts market behavior I would suggest stop loss to trader
4-DOWNTREND FROM MEDIAN INDICATOR (SCREENSHOT REQUIRED)
In the previous lesson we showed the bullish trend of the market which was shown in green
At this point, when the median line appears to be below the EMA, the market trend will be downward
This will require a good time frame in which the median line is purple, as seen in the screenshot below.
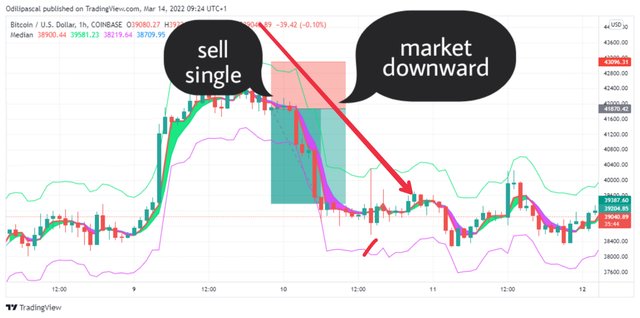
In the screenshot above we can see the rapidly declining market trend.
The market trend has changed from green to purple, indicating a sell-off
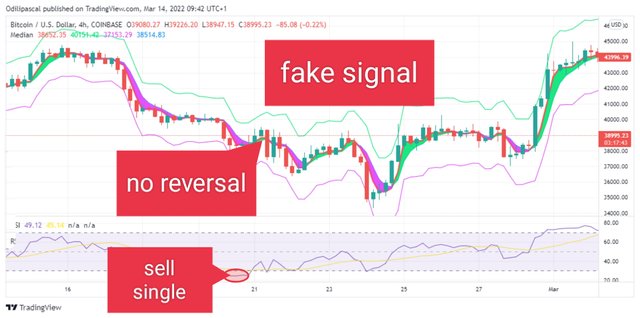
5-IDENTIFYING FAKE SIGNALS WITH MEDIAN INDICATOR(SCREENSHOT REQUIRED)
You do not always get the right single because the market is made up of many factors that change all the time. While RSI can also be used to capture the fake signals of the signal as the intermediate signal is no exception.
False signals can be filtered by combining them with other technical indicators so that the wrong signals can be filtered substantially.
For this I will filter the wrong signal from the middle signal. For this I have to add RSI signal.
RSI is an indicator of volatility that signals a reversal of the RSI's downward trend when the price is high and above the RSI-70.
The RSI below 30 indicates a reversal of the bullish trend
۔
۔
The screenshot shows RSI below 30 which indicates reversal
The median indicator is still showing purple. It has not given any signal of rapid reversal. Avoid such false signals.
6-OPEN TWO DEMO TRADES, LONG AND SHORT, WITH THE HELP OF A MEDIAN INDICATOR OR COMBINATION THAT INCLUDES A MEDIAN INDICATOR (SCREENSHOT REQUIRED)
We know that the median indicator determines the signs of ups and downs
I will use the median indicator indicator for demo trading
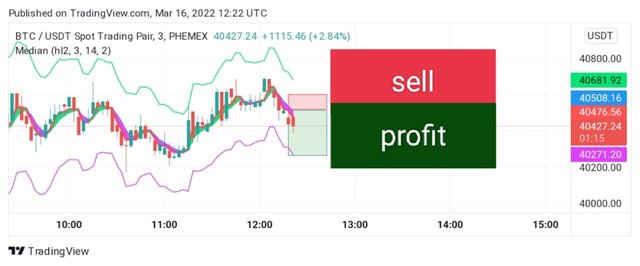
Buy entry
As we have learned in the tutorial, when the median signal changes color from purple to green, the median signals the purchase. In this screenshot the chart of BTC / USDT is taken.
In the screenshot we can see the middle indicator changing from purple to green which is clearly indicating a buy. Here I entered my entry through demo account on Trading View platform and set my tech profit. And also implemented stop loss to avoid damage۔
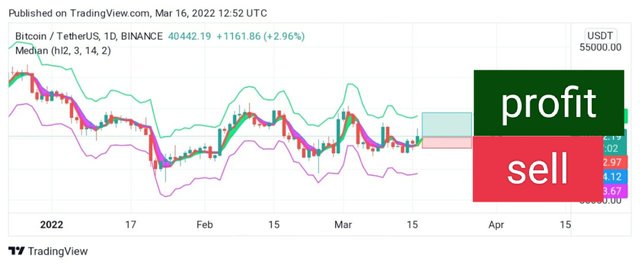
sell entity
When the middle signal changes color from green to purple the market starts to fall then the median indicates a sell
The indicator in the chart has changed from green to purple indicating a sell. As shown in the screenshot given below, I put a sales entry at this point, applying risk management and applying stop loss and take profit.
Conclusion
۔
The median indicator is an indicator that shows the correct trend of the market, with the help of which we can easily find the entry and exit points in the market and also it can detect fake signals. No market in the market is 100% accurate. Median indicator works better than all other indicators.
Use of Take Off Profit Stop Loss greatly reduces chances of loss.
A good analysis proves to be a good trade entry

Thank you to professor @abdu.navi03 for this amazing homework
Salam professor @abdu.navi03.
Please check my this home work post .
https://steemit.com/hive-108451/@sweet.colours/trading-strategy-with-median-indicator-steemit-crypto-academy-or-s6w4-or-homework-post-for-professor-abdu-navi03