THE CRYPTOCURRENCY TREND CALENDER
.jpeg)
INTRODUCTION
Hello Crypto lovers, traders and investors. I am glad to be here to share my thoughts on how the overall year calendar of cryptocurrencies trends look like. This post will help each every individual know how cryptocurrencies move through the year and help them trade appropriately.
I am making this post to share with the steemit family so each of us who trade cryptocurrencies will know when to trade. This is due to many losses incurred by crypto traders and investors in the market every year. Many persons have quited crypto and have left the crypto space because of the initial losses they incurred at the period they started crypto trading and investment.
Many persons have called crypto scam and a fraudulent way of making ends meet just because they started it at the wrong time, bought the wrong crypto and didn't know what to do when they got into deep shit. This post will clarify their doubts and give them a baton to run with in the relay of cryptocurrency assets.
CRYPTOCURRENCY SEASONS
There are basically two seasons in the cryptocurrency market. These are; The Bullish Season and The Bearish Season.
Bullish Season
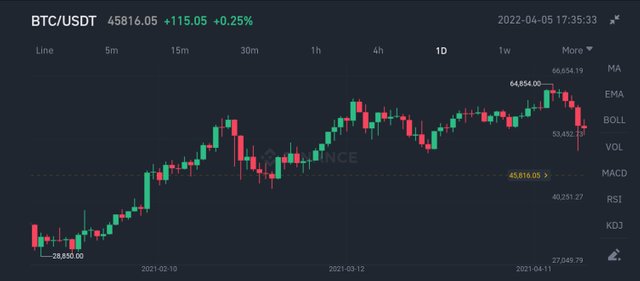
Chart of a Bullish Season
This also called the Bull season is a season where the market of cryptocurrencies are all in an upward move. Also called the season of uptrend, crypto assets have a great increase in price at this time. It is characterized by the many bullish candlesticks (green candles) and a few bear candlesticks (red candles) with many moments of uptrend and few moments of downtrend/pullbacks and a ranging market in a cryptocurrency chart. A bullish season can last for days, weeks, or months but within this time, the price of the assets keep making new highs almost everyday.
Bearish Season
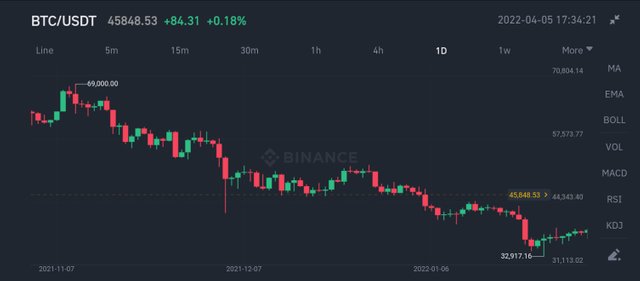
Chart of a Bearish Season
This can also be called bear Season or season of downtrend. It is a season where crypto assets fall in price continuously. In this season, prices of Crypto assets decrease greatly. It is characterized by the numerous bearish candlesticks (red candles) and few bullish candlesticks (green candles) with many moments of downtrend and very few moments of downtrend or pullbacks and ranging market in a cryptocurrencies' charts. Just like the Bullish season, bearish season can last for days, weeks or months but within this period the price of the asset is seen to decline more times than it goes up, making new lows almost everyday.
These two seasons can occur in a month but one season dominates the other. The dominant season takes the days, weeks, or months and that period is said to be either bullish or a bearish season.
THE TWELVE MONTHS OD THE YEAR Divided BETWEEN TWO SEASONS
After being in the cryptocurrency space for two years, I have been able to study the trends of each month. It will interest you to know that each month belongs to a particular season. Many traders have not taken time to see this and it has landed them in troubles over and over again. They have been in crypto for 3,4,5 or more years but can't see how this plays out every year.
***This is how the crypto calendar runs every year. ***
| Month | Season |
|---|---|
| January | Bear |
| February | Bull |
| March | Bull |
| April | Bull |
| May | Bear |
| June | Bear |
| July | Bull |
| August | Bear |
| September | Bear |
| October | Bull |
| November | Bear |
| December | Bull |
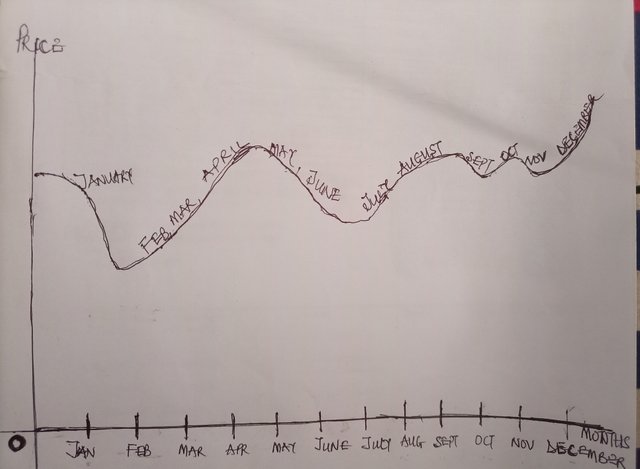
A Graphical representation of the Crypto Calendar
In January, the calendar, as seen in the graph, starts with a decline of price (bear) from the from the high price that was the previous year. The decline continues until February when the market starts going bullish, this continues until April where higher highs are made by assets. This may likely enter may but towards the 2nd week of May, there was a great decrease in prices of asset, this bearish trend continues all through June and in July prices begins to go up against until late August where the price fall a little before September kicks starts. A long bear occurs in September but in October, prices begins to gain momentum up before they started falling again in November. To crown a successful crypto year, the prices of assets led by the father of Cryptos goes up gradually while having some pullbacks that looks like a bear but price kept going up until the year ends.
Conclusion
The nature of the crypto calendar for each month I have stated doesn't all go bearish or bullish for each month they have been pointed for. The occurrence is usually mixed but one is dominant bringing either a bullish or bearish season for each month.