Trading Using Rectangle Pattern- Crypto Academy / S5W4 - Homework Post for @sachin08
The answers to the following questions will given below;
Explain Rectangle Pattern in your own word. 2. How to identify Rectangles. Explain with Screenshots. 3. Can we use indicators with this pattern to get accurate results? Explain with Screenshots. 4. Explain Rectangle Tops and Rectangle Bottoms in your own words with Screenshots of both patterns. 5. Show full trade setup using this pattern for both trends. ( Entry Point, Take Profit, Stop Loss, Breakout
Explanation of Rectangle Pattern
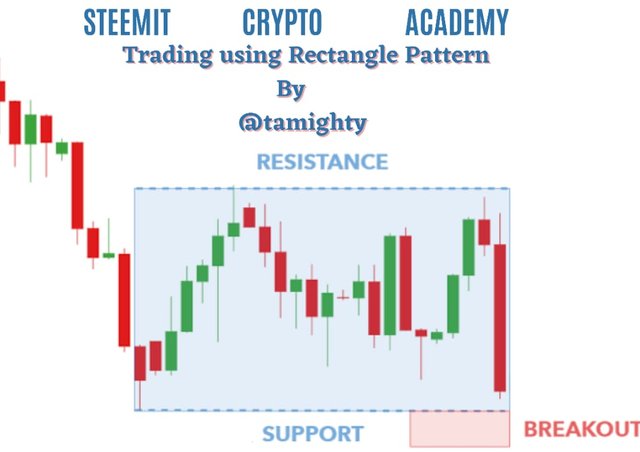
On price charts, a rectangle pattern can be seen. When the price returns to the same horizontal support and resistance levels several times, a rectangle is formed. The price can only move between the two horizontal levels to form a rectangle. A Darvas Box is comparable to the concept of a rectangle.
A rectangle is a chart pattern created through technical analysis. The word refers to a situation in which the price of a securities trades within a confined range with parallel levels of resistance and support, like a rectangle.
When investors are undecided about the long-term direction of an investment, they use the limited range, or rectangle. As a result, it fluctuates within the set range, unable to move in either direction.
Before a breakout, the price of the security will test the levels of support and resistance numerous times in a rectangular pattern. The security is regarded to be trending in the direction of the breakout whenever it breaks out of the rectangle's range in either direction.
Breakouts are not always successful. For example, the price could burst out of the rectangle to the upside before quickly falling back inside it. This is referred to as a failed break.
When price is bordered by parallel support and resistance levels, a rectangle is produced on the chart.
A rectangle represents a moment of consolidation or hesitation between buyers and sellers as they trade punches but neither has the upper hand.
Before eventually breaking out, the price will repeatedly "test" the support and resistance levels.
From there, the price may move in the direction of the breakout, whether upwards or downwards.
The rectangle is a classic technical analysis pattern that is defined by horizontal lines which indicates considerable support and resistance.
It can be traded successfully by buying at support and selling at resistance, or by waiting for a breakout from the formation and employing the measuring concept.
Identification of Rectangles
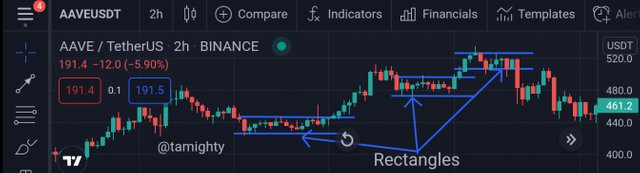
A rectangle appears during a period of consolidation, when the market is undecided about either a major upward or downward price move. The rectangle is generated by a series of two or more subsequent highs or lows that are nearly the same size, just like other continuation patterns. When these arise, traders might draw a line across the tops of the highs to show resistance, and a line across the lows to show support.
In identification, price has to bounce back and forth between a flat support zone on the bottom and a flat resistance zone on the top. A horizontal or flat trendline on top and bottom connects the minor highs. A parallel trendline is formed by drawing a trendline below the minor lows. For a legitimate rectangle, there must be at least two touches on each trendline. The touches don't have to be in order from top to bottom, but each trendline should have at least two clearly defined minor highs and lows that are close to or contact it.
In a similar situation, the trendline touches should be spaced out along the pattern rather than being all at once. To put it another way, the trendline should not resemble a diving board with one end that is unsupported.
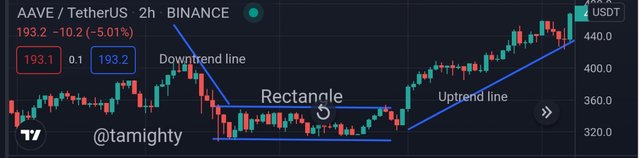
One more thing to note in the identification of a rectangle that the asset must be in a trend, either uptrend or downtrend. This is not to say that rectangles are not formed when the market ranges continuously for a long time. An uptrend can result in a rectangle if at the top the price starts to move sideways. A downtrend can result in a rectangle if at some points the price starts to move sideways.
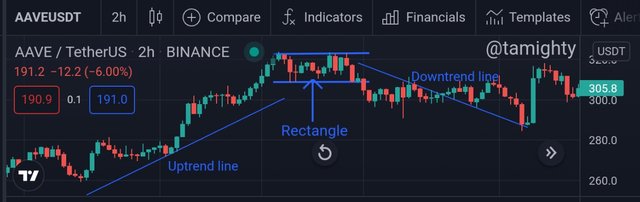
From the screenshots provided above, rectangles marks the end of a trend, leads to trend reversal and marks the beginning of a new trend.
Can Indicators be used with this Pattern to get an Accurate Result
Rectangle patterns are utilized to determine the best trading entry opportunities for buy and sell trades. Rectangle patterns can generate force signals due to the volatility of cryptocurrency assets; consequently, it is critical that the pattern's breakout points are corroborated with other patterns or technical indicators to ensure their legitimacy.
Because no single trading pattern, technique, or set of technical indicators will produce the greatest results, it's critical to combine the rectangle pattern with the use of indicators. This is done to confirm signals while also flushing out spurious ones.
As a trend-following design, the rectangle pattern is a good choice. To put it another way, if the breakout results in a trend, it's ideal to employ momentum or trend following indicators in conjunction with the pattern.
In order to validate breakouts and identify false signals connected with rectangle patterns, trend following indicators such as the parabolic sar and momentum indicators such as the stochastic oscillator or relative strength index might be useful.
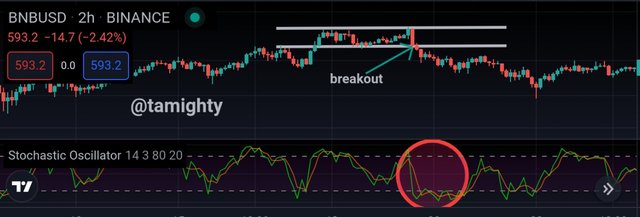
In the chart of BNB/USDT above, we see that the rectangle fully formed before the breakout to the downside happened. There was a sharp decline in the price of the asset. The indicator was at overbought level, signaling that the price could fall at any point in time. The decline in the price is also marked in the stochastic indicator used to demonstrate this. As the price went continually down, the indicator showed oversold as it went beyond the 20 reading.
Rectangle Tops and Rectangle Bottoms
Price is trending lower towards rectangle bottoms, whereas price is trending upwards into rectangle tops.
Rectangle Top forms at the top of a trend, while Rectangle Bottom forms at the bottom. Volume tends to recede across the length of a Rectangle Top, but volume tends to follow the breakout direction for Rectangle Bottoms.
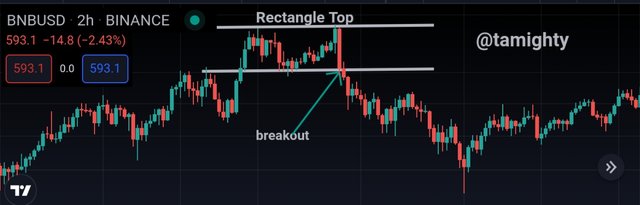
Rectangle Tops: When price tops out in an upward trend and begins to move sideways, it is called a rectangle top. When the price has recovered from a pullback but is unable to continue in the uptrend, it forms a rectangle top and begins to move sideways.
Rectangle tops are most often defined by a breakout in an upswing (a continuation of the previous trend).
They have been discovered to be at the forefront of the fashion trend.
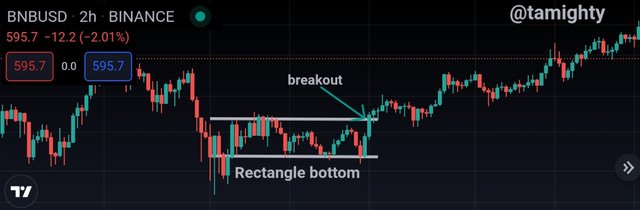
Rectangle bottoms: It can be found at the start of an upswing, in the middle of a downtrend, or at the end of a decline.
When an asset wants to rise, it can form a rectangle by moving its candle between support and resistance before breaking out to the upside. A rectangular bottom can be made this way.It can also form in the midst of a decline before continuing to the downside. It can signal the conclusion of a downward trend and the beginning of an upward one.
Full trade setup using this pattern for both trends. ( Entry Point, Take Profit, Stop Loss, Breakout
Trade entry for an Uptrend
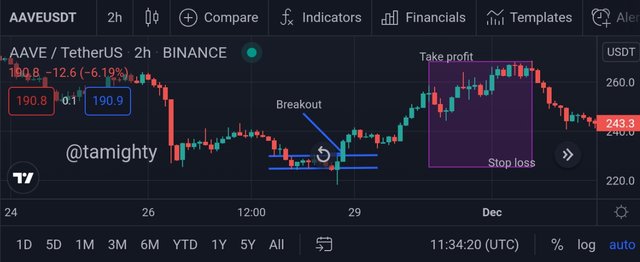
The entry point (buy entry) can be taken somewhere above the point breakout occurred.
Trade entry for a Downtrend
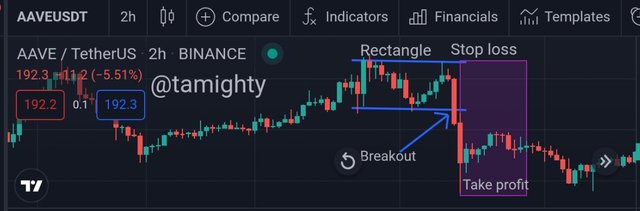
The entry point (sell entry) can be taken when the price went high. Since one cannot take it at the highest point, a market order can be made to take maximum profit.
The rectangular technique is a good way to start. It's a reversal trade signal as well as a continuation trade signal. They are, however, more potent when used as a continuation pattern because the trend is working in your favor. One thing to keep in mind is that this is one of the most effective ways to get started with a breakout strategy.