Support and Resistance Breakouts - Crypto Academy / S6W3 - Homework post for pelon53.

Hey guys,
Welcome to the first week of the SteemitCryptoAcademy trading competition.
In this first week, I will be joining the team of professors @pelon

QUESTION 1
The Support and Resistance zones are important key points on the price chart understanding and dentifying them is crucial for every trader.
There are several advantages of identifying these areas on the price chart and some of them includes;
- UNDERSTANDING MAKRET BEHAVIOR
Proper identification of the support and resistance zones aids traders in understanding the various activities and psycholology of buyers and sellers as these areas indicates the struggle between the two parties in knowing who will take control of the market.
At the support zones, buyers struggle to keep the price from further going down due to the actitivies of sellers while at the resistance zones, sellers struggles to keep the price from moving further up due to the activities of buyers.
- TRADING SIGNALS
Identifying the support and resistance zones also aid traders in making trading decisions.
Just as we already know that these regions indicates struggle between buyers and sellers, once the price breaks above the support zones, it indicates that sellers are much more stronger in the market and this will in turn signals a trader to take a sell position.
On the other hand, when the price breaks above the resistance zone, it indicates that buyers has the upper hand and a trader will be required to take a buy position in other to secure profit.
- REVERSALS
Identying the support and resistance regions also help traders to identify possible reversals. In trading, we believe that history tends to repeat itself and knowing that prices have previously reversed at these regions, a trader would actaully expect a similar outcome once price gets to either the support or resistance zones.
- TRADING CONFLUENCE
The support and resistance zones provide trading confluence for traders who trade using the indicators and other trading techniques.
For instance, a trader who is trading using RSI Indicator can easily find confluence if the RSI indicator is at the overbought region and the price is already at the resistance zone. When the above happens a trader can be more sure of a bullish-to-bearish price reversal.
QUESTION 2
Explain in your own words the breakout of support and resistance, show screenshots for the breakout of a resistance, use another indicator as a filter.
A breakout occurs when the price moves above the resistance or below the support and continue in a new trend.
There are various types of Support and resistance and they include;
- Horizontal support and resistance
- Sloping support and resistance
- Dynamic support and resistance
In this section I will be explaining the breakout of support and resistance using the dynamic support and resistance.
This type of support and resistance is usually identified using various trend indicators such as the SuperTrend indicator, Bollinger band, moving averages, etc.
The moving average indicator serves to provide support and resistance by trending above or below the price chart and once broken, a trend reversal is expected.
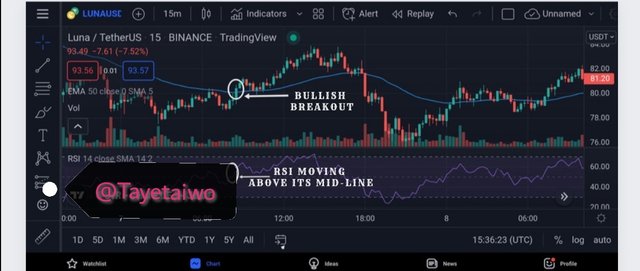
Looking at the above screenshot we will see that the price breaks above the dynamic resistance identified by the EMA on price chart. During the breakout, it was also observed that the RSI indicator has moved above its mid-line thereby confirming the signal provided by the breakout on the EMA.
QUESTION 3
We have already saw the importance of identifying the support and resistance regions. In this section, we will be looking into breakouts and how to identify them.
Breakouts occurs when the price moves above the resistance zone and continue in a new trend or breaks below the support zone and continue on a new trend.
I purposely added "continue in a new trend" because sometimes a breakout occurs and just after a while the price reverses and continue in its previous trend direction. When this happens, the breakout is regarded as false.
In other to filter out false breakouts, we normally apply other technical analysis tools in other for it to provide confluence thereby reducing the risk of falling for false breakouts.
- Screenshot
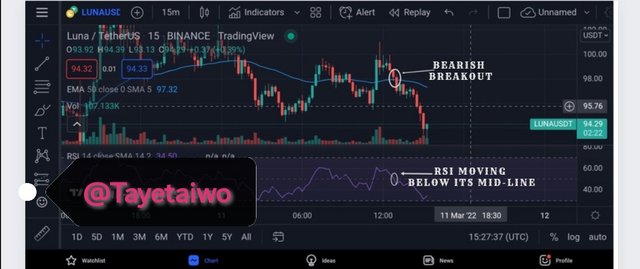
The above screenshot shows a dynamic bullish-to-bearish breakout on an EMA and an RSI Indicator was added to filter out false signal by providing confluence just as seen above.
QUESTION 4
A false breakout occurs when the price breaks above a resistance zone or below a support zone but fails to continue its new trend after a very short while.
This occurs due to the manipulation of the market by strong hands (whales) who lure retail traders (weak hands) into believing that an actual breakout has occurred which in turn makes them open position in direction of the new price trend which doesn't last before reversing to continue in its formal price direction. This results in liquidation of retail traders positions.
- Screenshot
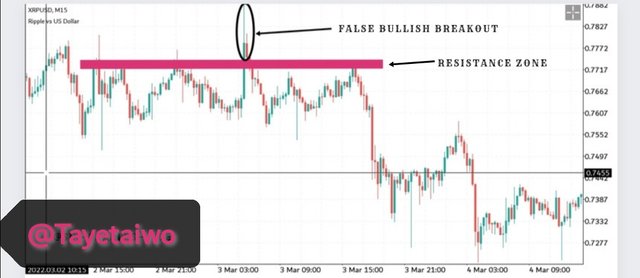
From the above screenshot, we will see that during the continuous retest of price on the resistance zone, the price actually broke above the zone due to the buying pressure initiated by the strong hands, this outbreak of price above the resistance zone can easily lure retail traders into believing that the price will continue to move up dur to the breakout.
This will make them open buy positions and not long after that the strong hands closes up them thereby making the price to come crashing down again this liquidating the positions of the retail traders.
In other to minimize the risk of falling for a fake breakout, a trader should wait for a confirmation candle before initiating either a buy or sell order after a breakout.
Also, combining other technical analysis tools for confluence purposes helps a trader to reduce the risk of falling for false breakout.
It is also more advisable to wait for a retest before taking a position after a breakout.
- Screenshot
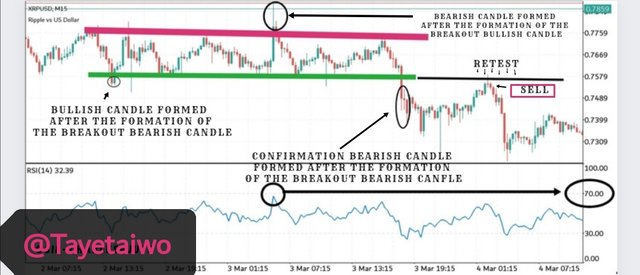
From the above screenshot, we will see that the first breakout that occurred on the support zone didn't allow the formation of confirmatory bearish candle instead a bullish candle was formed immediately after the breakout thereby reversing the price to continue above the support thus making the breakout false.
A similar case was observed at the breakout on the resistance zone but coming to the last and successful breakout on the support zone, a confirmatory bearish candle preceeded the breakout thus clearly indicating that sellers have taken control of the market as at that moment.
Also, the application of other technical analysis tool such as RSI indicator also will help to avoid falling for the fake breakout because looking at the screenshot above, we will see that at the point of breakout, the RSI indicator was already almost at the overbought region thereby siganalling bullish-to-bearish price reversal.
A trader who is observant will know that this isn't an act of confluence and therefore should wait to see further outcomes before taking a position.
Also from the screenshot above, we will see that the price retested the broken support which now serve as a resistance. During this retest, it was also observed that the RSI indicator is almost at the overbought region (mark 70) which indicates an overbought of price.
This, together with the fact that the price is currently at a resistance zone, serve as confluence thereby increasing the chance of a positive trade.
QUESTION 5
On this section, I will be making a trade using the resistance strategy.
The analysis was performed on SOL|USDT pair on trading veiw app.
I first added a 100-EMA on the price chart in other to properly identify the trend direction which will aid me in trading in direction of the current trend.
The EMA also serve to identify the dynamic support and resistance levels on the price chart thereby allowing me to spot breakouts either above or below the EMA.
In addition, an RSI Indicator was added in other to provide confluence which will increase my odds of winning my trade.
- Screenshot
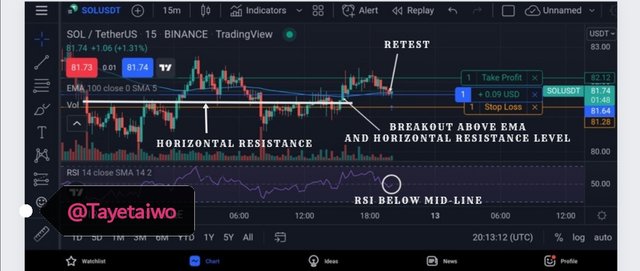
From yhr above screenshot we will see that the price broke above the EMA along side the horizontal support.
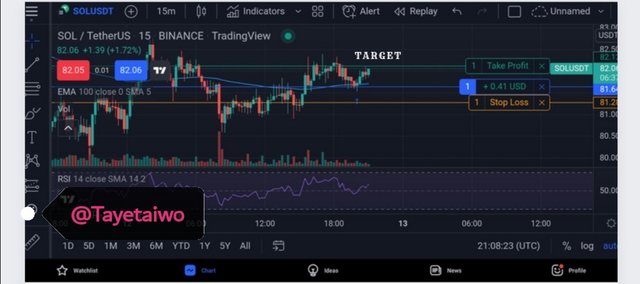
After the breakout, I waited to make sure that the trend won't be short lived by waiting for a retest which was later spotted before I took a buy position.
- Result.
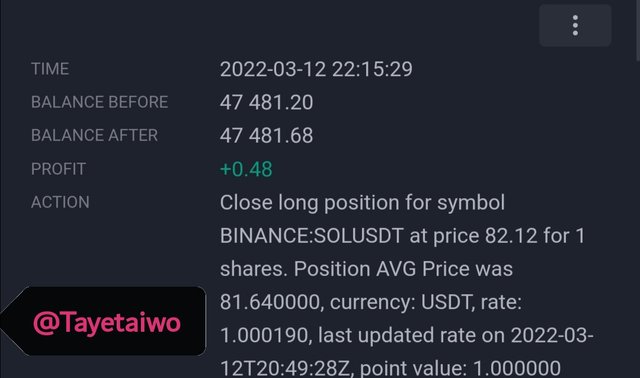
QUESTION 6
On the section, I will be performing a demo trade in consideration of the support level.
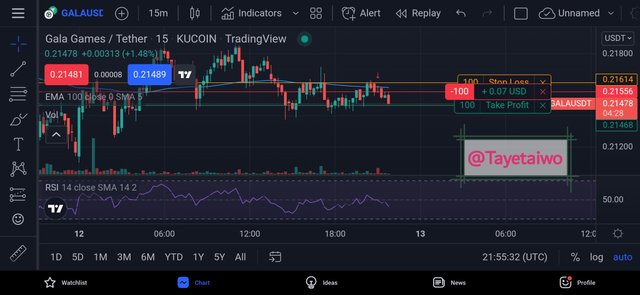
I performed my analysis on GALA|USDT pair on tradingveiw app.
I started by adding A 100-EMA on the price chart in other to identify the trend direction. This is to avoid trading against the trend.
The EMA also serve to identify the areas of dynamic support and resistance. After this, I added an RSI Indicator which will serve to provide confluence.
- Screenshot
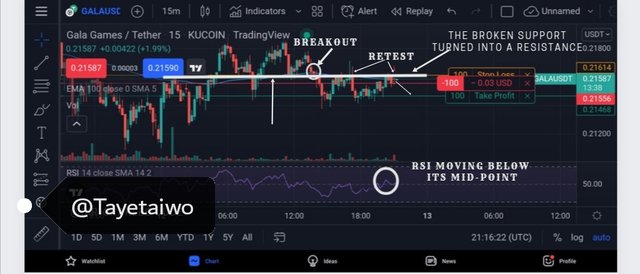
From the above analysis, the price broke through its support and continued on a new trend. In other to avoid falling for a fake breakout, I waited for the price to retest on the just broken support which now serve as a resistance. After I missed the first retest, I waited patiently to see if the price would retest which it did and I took my sell position by also considering the position of the RSI indicator which was currently moving below its mid-point.
- Result
CONCLUSION
The support and resistance areas are created based on the struggles between buyers and sellers in other to take control of the market.
This areas are key areas on the price chart because they make apparent who is in control of the market at any point either buyers or sellers.
In as much as these areas are usually apparent, it is best to add other technical analysis tools for proper identification which will aid a trader to maximize profit and minimize loss.