Crypto Trading With Chaikin Money Flow Indicator - Crypto Academy / S4W6 - Homework Post for @kouba01
Hey Guys..!!
Meet again with me Wahyu Nahrul on the other Steemit Crypto Academy homework. Today I will be working on homework given by one of our professors @kouba01.
The homework given by our professor this week is about Crypto Trading With Chaikin Money Flow Indicator.
Okay, just get to the discussion. Happy Reading !!

Chaikin Money Flow Indicator
Money flow is one of the most important factors in predicting price movements of a commodity market, by knowing how the movement of money flows in the market, we can predict prices and see what trends are happening in the market so that by knowing these 2 things so we can determine when we will buy an asset or when we will sell it. One of the indicators that serve to see the flow of money in this market is "Chaikin Money Flow".

The Chaikin Money Flow is an indicator introduced by a well-known technical analyst on the stock market named Marc Chaikin. This indicator is made to measure the amount of Money Flow Volume during a certain period which will be a tool to measure buying or selling pressure in the market.
Just like indicators in general, the display of CMF is presented using a moving line and will show a number with range 1 to -1 which will indicate the distribution phase with 0 as the centerline which will indicate the distribution phase.
When the CMF line moves closer to or even touches the upper limit of the range, namely number 1, this indicates that there is an increase in buying volume which results in greater buying pressure than selling pressure.
On the other hand, if the CMF line moves closer to or touches the lower limit of the range numbered -1, then there is an indication of an increase in selling volume so that more people are selling than buying during that period.

Calculating Chaikin Money Flow Indicator Value
To calculate the value generated by the Chaikin Money Flow indicator, there are 2 ways that can be used, these include:
1. The First Way
The first way to calculate the value of the Chaikin Money Flow indicator is to use the following formula:
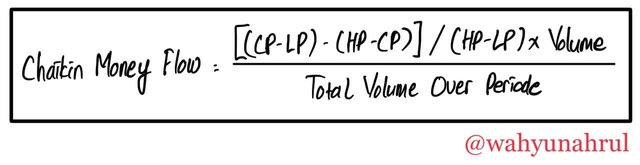
Where:
- CP: Closing Price
- HP: Highest Price
- LP: Lowest Price
2. Second Way
The next method that we can use to calculate the value of the Chaikin Money Flow indicator is somewhat different from the first method, in this way we have to go through several stages using the following formulas:
Calculating Cash Flow Multiplier
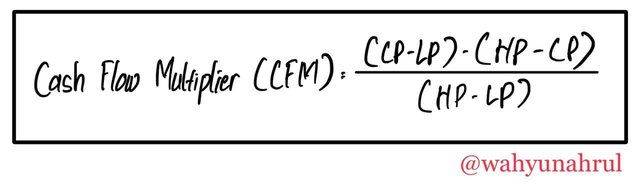
Where:
- CP: Closing Price
- HP: Highest Price
- LP: Lowest Price
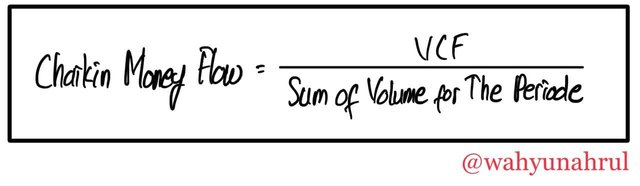
Calculating Volume of Cash Flow

Calculating Chaikin Money Flow
Now I show you examples of calculations in both ways, before that I will try to take data from a cryptocurrency market as a real example of calculations using both methods which can be seen in the graphic image below.
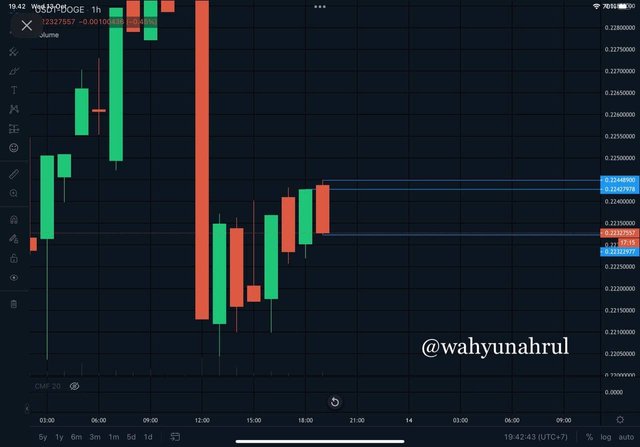
In the DOGE/USDT chart image above we can get some data as follows:
- Closing Price: $0.2242
- Highest Price: $0.2244
- Lowest Price: $0.2232
Assuming volume data as follows:
- Volume of the period: $1,000,000
- Sum of the Volume for the period: $1,500,000
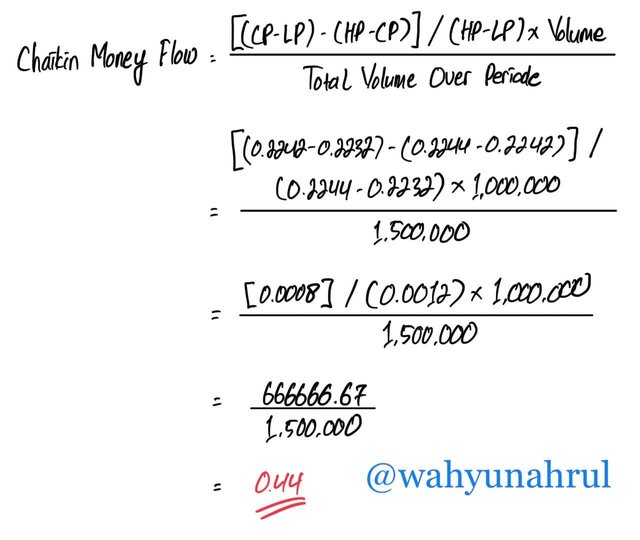
1. The First Way
2. Second Way
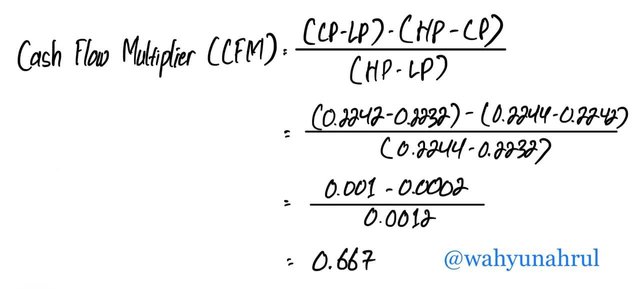
- Calculating Cash Flow Multiplier
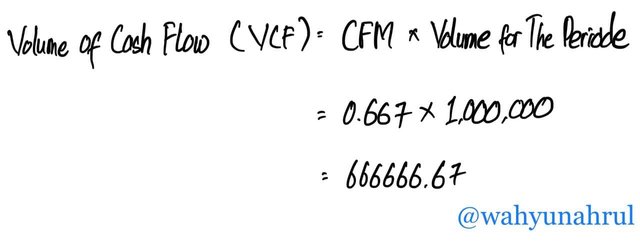
- Calculating Cash Flow Volume
- Calculating Chaikin Money Flow
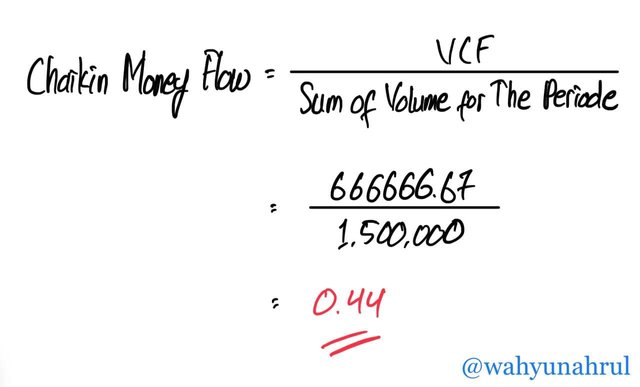
From the two methods, we can see that the final result is the same, namely at 0.44. This proves that both of these methods can be used to calculate the value of the Chaikin Money Flow indicator.
And from these results, we can conclude that Money Flow in the DOGE/USDT market is being dominated by Buyers, which also caused the DOGE market to increase in price.
Adding Chaikin Money Flow Indicator to Charts on Bittrex
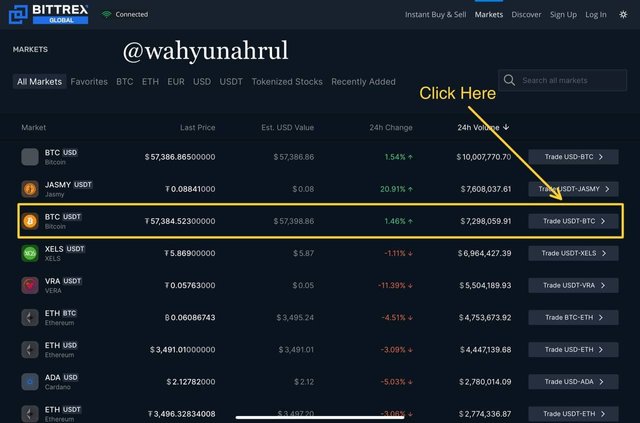
Now I will show you how to install the Chaikin Money Flow indicator on a cryptocurrency chart, the platform I use in this example is Bittrex which is one of the most famous cryptocurrency exchanges globally.
The first step we take is to visit the official website of Bittrex and we will be shown the initial appearance of this website which will look like the image below.

Then we scroll down until there is a "Market" menu and we can choose the cryptocurrency market we want, here I will select the BTC/USDT market, and to open it we click on the "Trade USDT-BTC" button which is on the right.
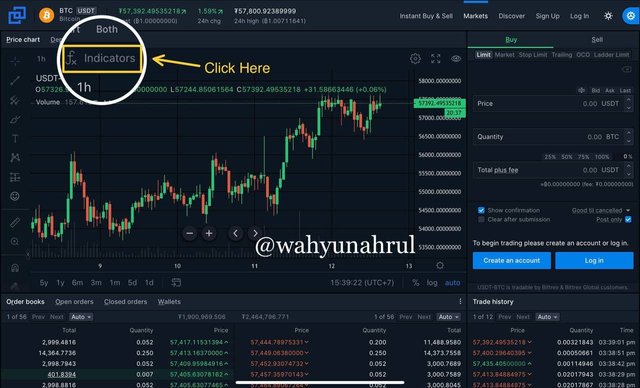
After that, we will be taken to another page which contains the order book, trade history, and of course the chart of the BTC/USDT market, to enter the CMF indicator we select the "Indicators" option at the top of the chart.
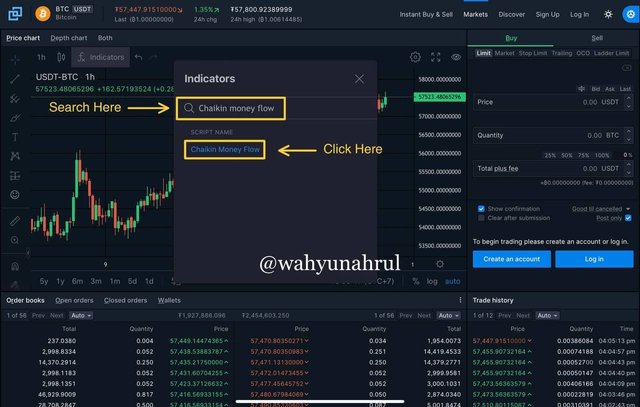
After that, we look for the CMF indicator in the search column, and after the CMF indicator appears on the indicator name menu, click on that name.
So that we can see it more clearly, we click the enlarge chart option at the top right of the chart.
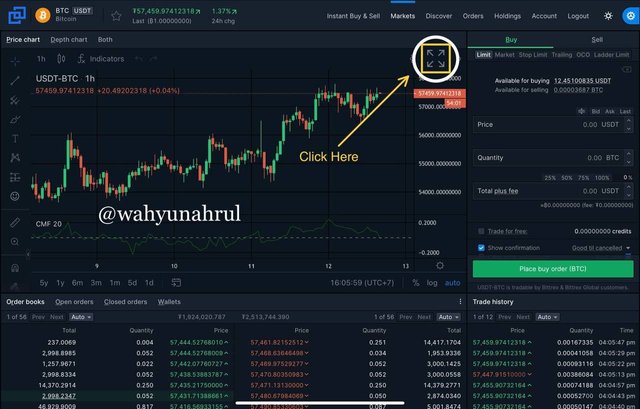
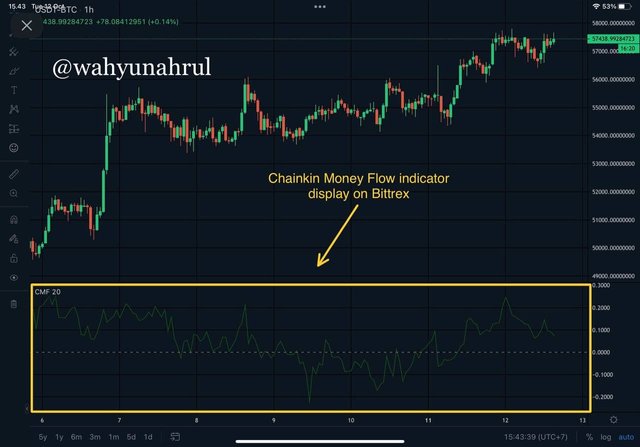
After that, we can see at the bottom of the graph that the Chaikin Money Flow indicator has been successfully added.
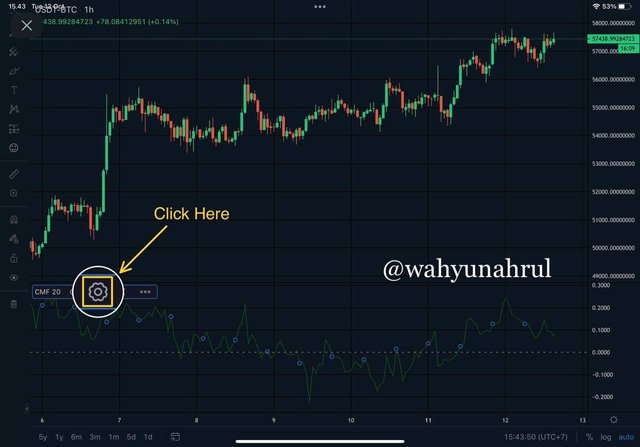
To change the settings of the CMF indicator on Bittrex, we select the setting option which has a gear-like icon at the top of the CMF indicator.
There are 2 things we can set on the CMF indicator on the Bittrex platform. The first is that we can change the style so that the CMF indicator display is shown on the graph according to our wishes. We can change the color, thickness, and type of lines on the CMF indicator.
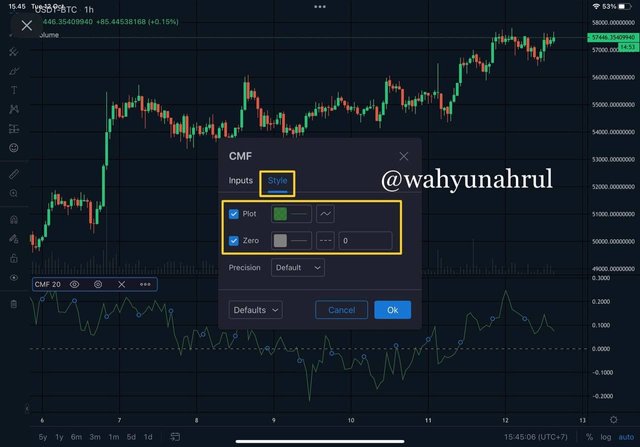
Then the second setting that we can change is the length of the period of the CMF indicator, we can change the length of the CMF indicator according to our wishes on the "Input" menu.
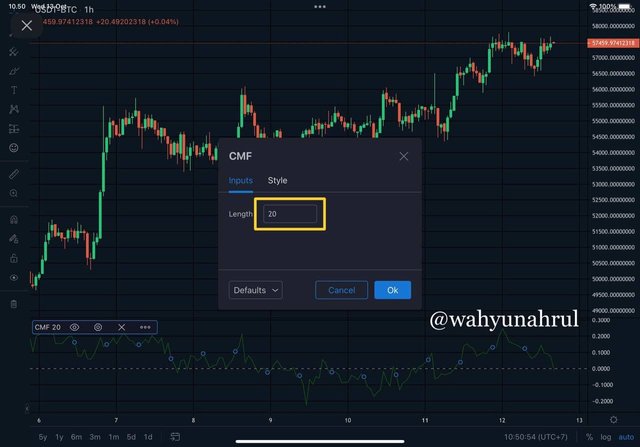
In setting the length of the CMF Indicator there are several things to pay attention to. The CMF indicator is set to the default length of 20 or 21, which means the CMF indicator moves based on the data in the previous 20 or 21 periods. This setting was chosen by the maker of the CMF indicator that the city discussed earlier, namely Marc Chaikin.
This was made so because from the beginning the CMF indicator was an indicator made for the stock market and what we should know is that the stock market is a market that has open and close times, unlike the cryptocurrency market which is always open 24 hours a day and 7 days a week. So that in 1 month the number of days which are open days for the stock market is not 30 or 31 days but 20 or 21 days.
So I think the best setting that we use for this indicator is to first look at the trading style of each trader or investor. If we are a short-term type of trader, it would be better to use a shorter length so that the CMF indicator will be more sensitive in seeing the money flow in the market. Meanwhile, if we are long-term traders, we can use the default length of 20 or 21 or a longer length so that it will minimize false signals that will be displayed by the CMF indicator.
The Role of the Chaikin Money Flow Indicator in Confirming the Direction of the Trend
As discussed in the previous discussion that the CMF Indicator is an indicator that can show buying or selling pressure in the market, this buying and selling pressure can also be a confirmation point where the trend is going, whether it is a Bullish Trend or a Bearish Trend. We can see all of these things through the movement of the CMF line that crosses the center line (line 0) which is in the middle of the CMF indicator.
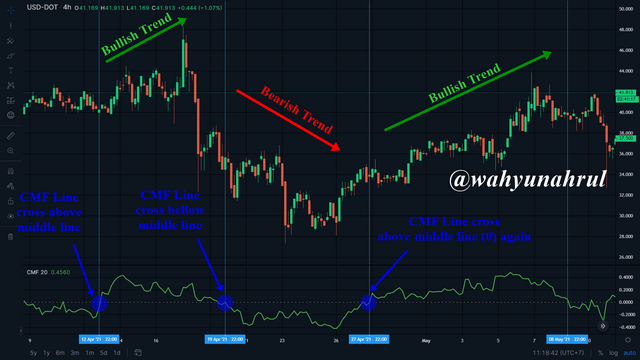
We can see in the example above which is a chart of the DOT/USD market, there are several incidents where the CMF indicator line moves up and down and crosses the centerline on the CMF indicator. After the CMF line has crossed the middle line, there is a reversal in the market.
The first example we can see from the far left of the CMF line moving from below the middle line to the top, then after that, we can see that the price of Polkadot has increased so that a Bullish Trend occurs. After that, the CMF line moved back down and finally crossed the middle line again and we can see that the trend which was originally bullish has turned into bearish. And finally, we can see again that the CMF line is moving upwards, followed by price movements from Polkadot so that the trend once again turns to Bullish.
From here we can see that the direction of the line on the CMF indicator really represents the movement of the price of a cryptocurrency so that we can use the CMF indicator as a confirmation of the trend that is happening in a cryptocurrency market.
For example, we can see in the chart above that Polkadot is experiencing a Bullish Trend, by using the CMF indicator, we can buy and sell on the DOT/USD market several times by relying on the CMF indicator.
At the first moment, we can see that the CMF line has crossed the middle line, so at that time we make the first purchase, after that, we wait until the CMF line moves downwards and crosses the middle line again and that's when we make a sale. All of these things we can keep doing as many times as we want.
Trading With Crossover Signals and Wider Lines
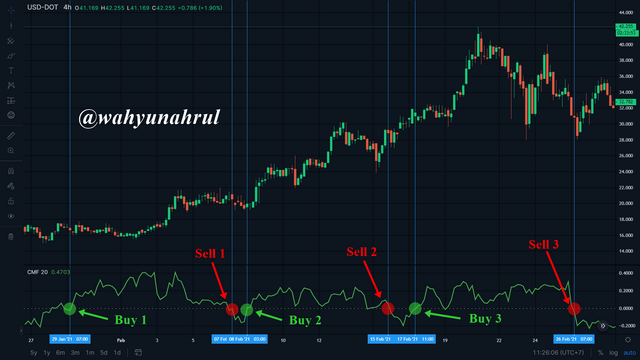
On the CMF indicator, we can trade by adding a wider line that we can use as a signal cross which becomes a confirmation point for entering and exiting a trade. Based on the learning given by professor @kouba01 there are 3 crossing signal lines that we can add to the CMF indicator as +/- 0.1, +/- 0.15, and +/- 0.2. Here I will take +/- 0.2 as the signal line crossing which I will add to the CMF indicator.
I chose +/- 0.2 because it has a larger range among the three options so it will reduce the false signals given from line movements on the CMF indicator. To use this crossover signal line, I will make a benchmark which includes:
Set buy entry if the CMF line crosses above the 0.2 crossover line and take profit if the CMF line crosses below the -0.2 crossover line.
Set sell entry if the CMF line crosses below the -0.2 crossover line and take profit if the CMF line crosses above the 0.2 crossover line.
1. Buy Trade (UNI/USD - Crossover Line +/- 0.2)
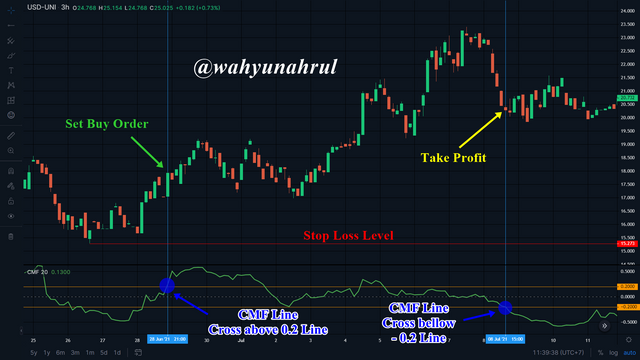
In the chart above we can see that I have added crossover lines at the 0.2 and -0.2 levels on the CMF indicator. After that, the CMF line moved towards the top and crossed the 0.2 crossover line, which means it became my confirmation point to buy at that price. After that, the price movement from Uniswap continued to increase and the CMF indicator line continued towards the bottom until it finally crossed the crossover line at the bottom which was at the -0.20 level. It was at this point that I decided to exit the trade and take profit from the trades I had already made.
2. Sell Trade (UNI/USD - Crossover Line +/- 0.2)
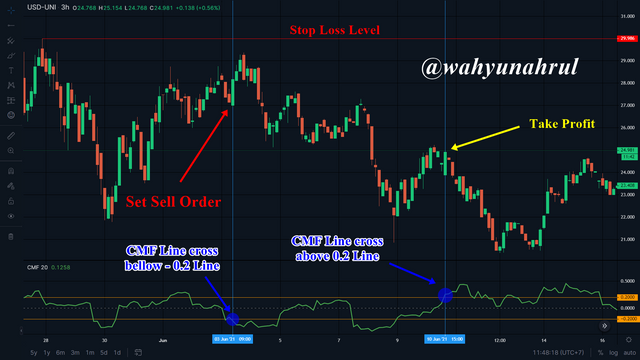
In the chart above, we can see that the CMF line is moving downwards and until it passes the crossover line - 0.2 which means it is my confirmation point to make a sell entry. After that, the price movement from Uniswap continued to decline and the CMF indicator line continued to change with dominance towards the top, then finally crossed the crossover line at the top which was at the 0.20 level. It was at this point that I decided to exit the trade and take profit from the trades I had already made.
Trading With Divergence Between CMF and Price Movement
Just like other technical indicators, not always the movement of the Chaikin Money Flow (CMF) indicator moves in accordance with the direction of the trend movement of a cryptocurrency. There are times when the line movement shown on the CMF indicator moves against the direction of the current trend in the market or is often referred to as "Trend Divergence". However, we can take advantage of moments like this, because trend divergence is a moment where there will be a very large trend reversal so that we can gain momentum to trade at the most ideal price.
As usual, there are 2 types of trend divergence which are Bearish Divergence and Bearish Divergence and I will explain them one by one to you.
1. Bearish Divergence
Bearish divergence is a moment where the current trend direction in the market is in a Bullish trend but the line on the CMF indicator moves the opposite direction towards the bottom which seems to indicate a bearish trend.
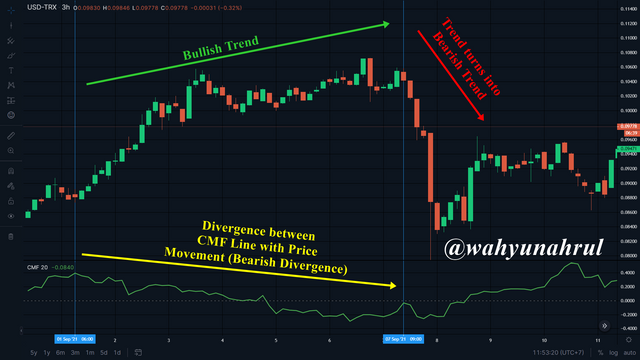
At times like this, it is an indication that the market conditions are overbought where the market is starting to shift from buyer domination to seller domination. This means that in the near future there will be a deep trend reversal. And as we can see in the picture above, there has been a fairly deep price decline from the TRX price which was initially experiencing a Bullish Trend turning into a Bearish Trend.
2. Bullish Divergence
Bullish divergence is a moment where the current trend direction movement in the market is in the Bearish trend but the line on the CMF indicator moves in the opposite direction towards the bottom which seems to indicate the trend is Bullish.
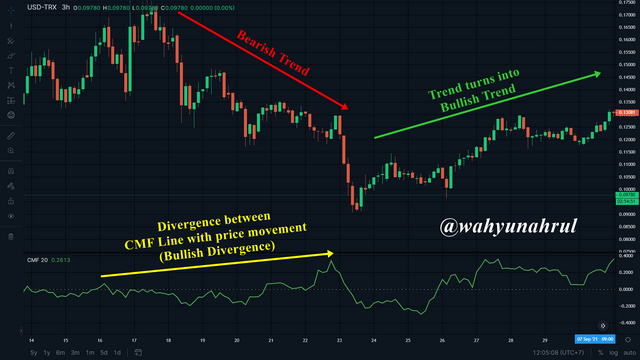
At times like this, it is an indication that the market conditions are oversold where the market is starting to shift from seller domination to buyer domination. This means that in the near future there will be a significant trend reversal. And as we can see in the picture above there is an increase in the price of the TRX price which was initially experiencing a Bearish Trend turning into a Bullish Trend.
3. False Signals of Trend Divergence
Although Divergence is a moment that is quite rare and is often used as a momentum point to enter a trade. However, we must be careful in using this divergence trend because the momentum signal it gives is not a trend reversal signal.
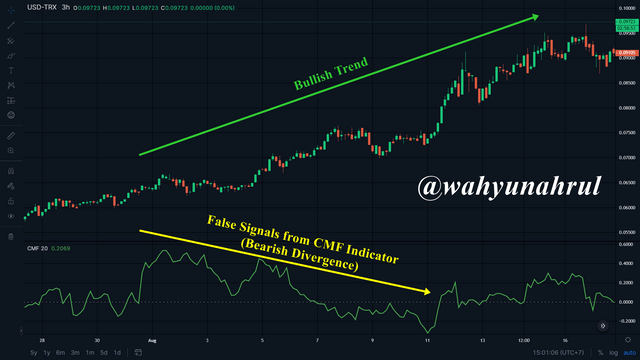
For example, we can see in the chart above that the trend is bullish and there is a signal from the CMF indicator about a bearish divergence momentum which initially indicated that there was a trend reversal from bullish to bearish in the TRX/USD market. But we can see that the trend reversal didn't really happen and that the price of TRX continued to climb up and continued its Bullish Trend.
From here we can conclude that we can not always use the momentum of Trend Divergence as a benchmark for trading. We must always be careful in making trading decisions so as not to get caught up in false signals as in the example above.
To reduce these errors we can trade using a longer indicator length and combine it with other technical indicators in order to get other confirmations so that we don't need to rush into making decisions in trading on the cryptocurrency market.
Last Word (Conclusion)
Chaikin Money Flow is a technical indicator that is able to provide money flow conditions in the cryptocurrency market. From all the discussions that I made based on the questions given by professor @kouba01, I concluded that this indicator is able to show well how the conditions of money movement are in the market, then this indicator can also be used as a momentum indicator where we can enter trades at the cryptocurrency market with market conditions that are ideal for the type of entry that we will do.
But it must be underlined that this indicator is not a very magical indicator and is able to provide us with continuous profits. There are moments where it will give false signals that can trap traders who are too careless. Therefore we must continue to be careful in making decisions in making trades and to always combine several other technical indicators so that the signals given can be confirmed properly.
Those are some of my explanations regarding Crypto Trading With Chaikin Money Flow Indicator, I apologize if there are still many mistakes that you can get when reading my explanation earlier, I would be very grateful if you told me in the comments column below.
Thank you for reading my blog, hope it will be useful for all of you. 😁
Hi @wahyunahrul
Thanks for participating in the Steemit Crypto Academy
Feedback
Total| 10/10
This is excellent work. Thanks for demonstrating your understanding of Trading using the Chaikin Money Flow Indicator.
Thank you for the remark prof!
Gracias por la explicación.
thanks for the information my friend, very useful post