Effective Trading Strategy using Line Charts -Steemit Crypto Academy | S6W1 | Homework Post for @dilchamo
Hello friends, welcome to my blog again after a long time I participated in the academy. I hope to participate and give us the required pleasure to read through my contribution as required in the homework task presented by Prof @dilchamo on "Effective Trading Strategy using Line Charts". Let's get started.

Question 1: Define Line charts in your own words and Identify the uses of Line charts.

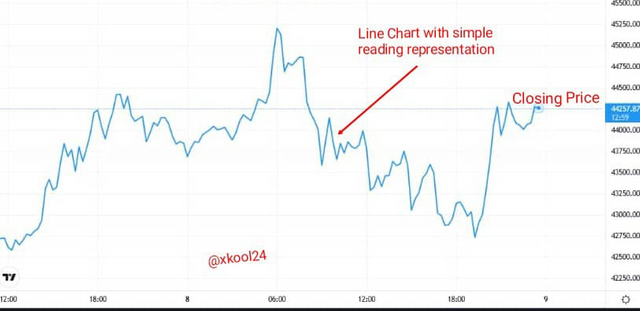
The Line chart is like every other chart analysis which represents a technical analysis with the emphasis on improving the profitability of trading by investors. This concept of chart analysis was developed by Charles dow who believes there was no need to distort the real price value of an asset rather derives all that is required from its closing price. That is to say, the Line chat concept is an easy one that does not take into cognizance the ambiguity of computing different parameters towards deriving its value rather traders only depend on the Closing Price of the given asset.
This form of chart analysis does not allow ease of reading that aids trading but as well limits the noise from the market (fakeouts/false signals) which vis-a-vis promotes strong signals towards making valid trade positions. Also, the use of a line chart cut across usability and adaptability as observed amongst professionals and beginners as there is no complexity in its readings. In using the Line chart analysis, one can as well identify other fundamental trading strategies like the Support and Resistance levels which are veritable points to make trading positions. How to Identify Support and Resistance levels using Line Charts (Demonstrate with screenshots)
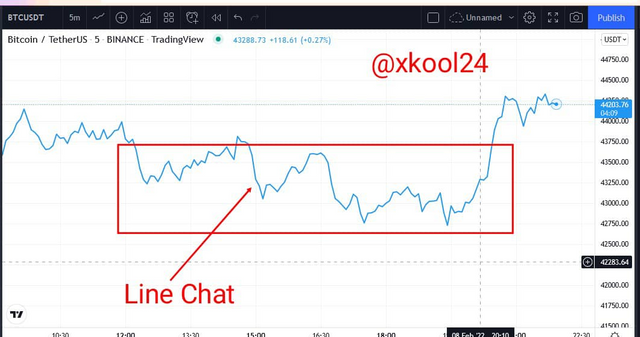
In applying and having a good representation of the Line Chart on given chart analysis, I will be demonstrating this using the Tradingview.
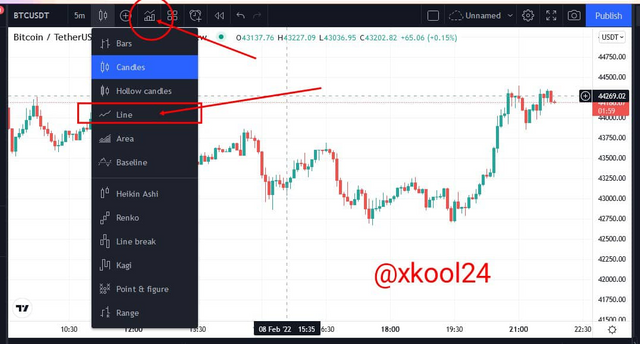
- Launch the Tradingview and click on the chart option
- From the landing interface, Click on the indicator icon on the toolbar
- Then select the Line Chart indicator from the dropbox options
Question 2: How to Identify Support and Resistance levels using Line Charts (Demonstrate with screenshots)
I will want to give a detailed explanation of the support and Resistance levels in any given chart analysis relative to the Line Chart. They are variable points and key levels that every trader looks out for while trading which also allows for an informed trade position and profit maximization.
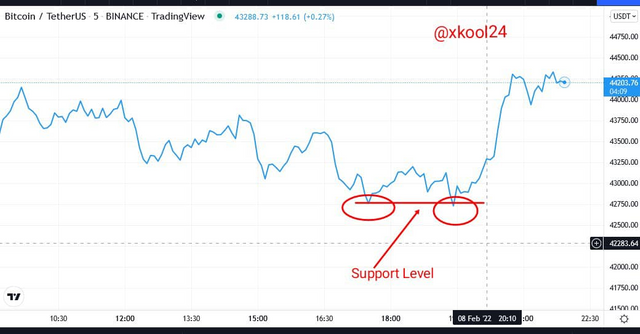
In the Support level scenario, we are basically going to see a situation where price trends make Lower-lows and Lower-highs positions and levels in which buying pressure keeps pushing up price trends. A typical Support level comes with a situation where we have more Buying Pressure sustaining price trend over Selling pressure in trade.
In getting a more valid support level in any line chart analysis, we will have to capture a minimum of at least two points where the price trend could not break through simultaneously. In so doing, support level indicates a stop of price devaluation or a scenario where an asset is losing its value to the activities of buy and sell where there is more selling pressure. One key thing that proceeds a Support level is the Upward movement of the price trends.
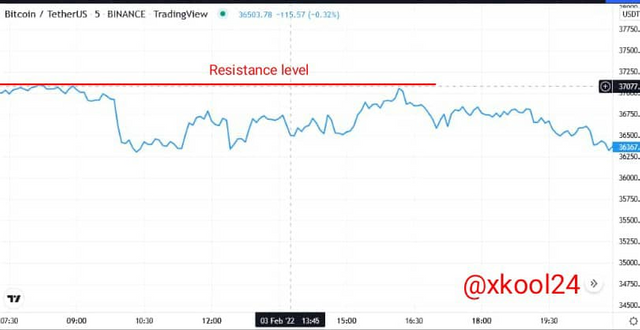
For the Resistance Level Scenario which happens to be the opposite of the Support level situation, we lookout for a level where the price trend is unable to break through a ceiling. This is due to the inefficient buying pressure to sustain the drive observed in pushing the price upwards and hence we have more Selling pressure.
In a typical resistance Level, we have the presence of higher-high and higher-low points created by price trends but In getting a more valid Resistance level in a Line chart analysis, we have to draw a line that cuts through a minimum of two points in which price is unable to break through a certain level or point. One key thing that proceeds a resistance level is the downward movement of the price trends.
Question 3: Differentiate between line charts and Candlestick charts.( Demonstrate with screenshots)
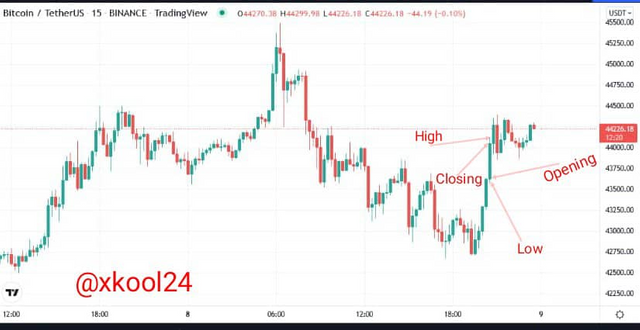
This different chart analysis indicates has distinctive features which he differentiates them. For the Line Chart, it is a concept only make use of the Closing price of the trend to determine the asset value over a given period whereas the Candlestick chart puts into consideration the Opening, High and Low prices in conjunction with the closing price.
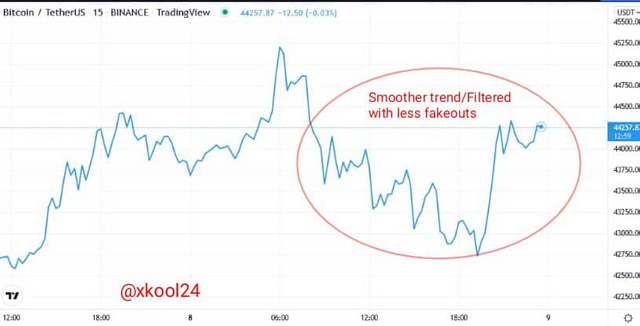
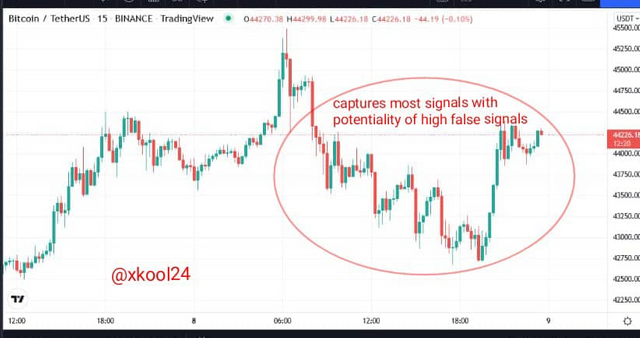
Whereas the Line Chart is easy to read with less noise in the market (False Signals) due to its potentiality to give valid signals in a long time frame, the candlestick chart tends to give all market signals with a high tendency of fakeouts.
In the application of some market tools and risk aversion strategies which include the Stop Loss and Take Profit, the Candlestick charts tend to be more feasible in use than the Line chart indicator.
Question 4: Explain the other Suitable indicators that can be used with Line charts. (Demonstrate with screenshots)
There is no stand-alone indicator that has all the perfection of existence hence indicators tend to perform better when combined with other indicators. In illustrating this, I will be combining the RSI indicator with the Line chart. The Relative Strength Index is one of the commonly used momentum indicators which helps in showing the strength of trend relative to the different regions in which it depends.
The RSI helps in determining the existence of a trend when it's building up as well as when it is weak or strong. It runs on different band readings of 0 - 100. When a trend is found between the 0 -30 bands, one can validly say it is in the Oversold region and when it is between 70 -100 bands, the trend is in the Overbought region.
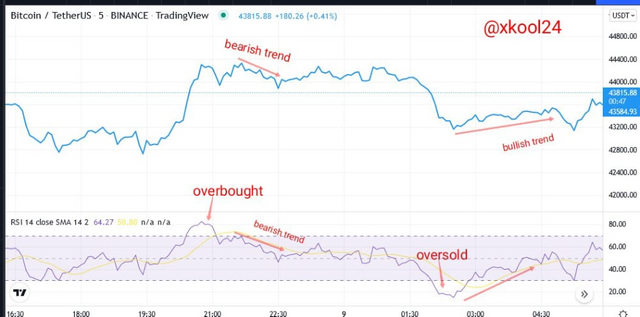
Trade signals help the trader to know how best to utilize making trade positions while in the market. Just for an example, an Overbought region entails that the trader should anticipate a possible Bearish trend reversal whereas the Oversold region brings about a possible Bullish trend reversal.
Question 5: Prove your Understanding of Bullish and Bearish Trading opportunities using Line charts. (Demonstrate with screenshots)
Just as I mentioned in the last question where the RSI indicator was combined with the Line Chart indicator, it is obvious that this gives us a clear understanding of the Bullish and Bearish trading Opportunities in a typical Line Chart analysis.
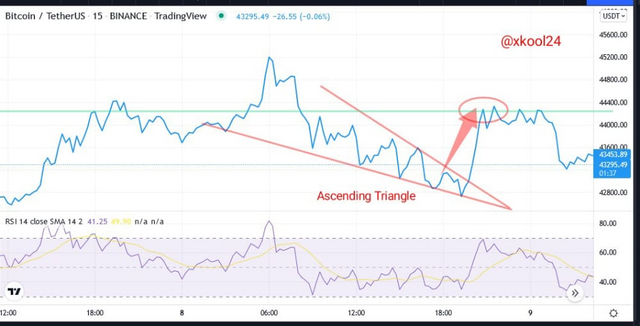
Other strategies like using the descending and ascending triangle can also give us a leap in achieving this.
From the image above where the RSI was introduced, we will always anticipate a trend reversal in any of the regions (Oversold, Overbought) where the price trend is found. This is because, when the price is observed at the Overbought region, it simply tells us that the given asset has reached its peak price with possible trend reversal in the opposite direction. At this stage, there is trend exhaustion and hence there should be more selling pressure overwhelming the buyer activities. This scenario is also applicable to the Oversold region. We have trend exhaustion where buying pressure starts to overwhelm the selling activities in the trade and hence trend making a reversal in the opposite direction.
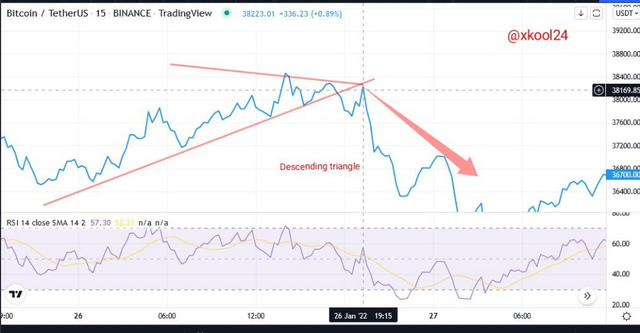
On either hand, while using the Descending and ascending Triangle, we have to make sure while drawing the lines that a minimum of at least two points are intersected for both scenarios.
For the Ascending triangle, we have an anticipated bullish trend reversal in an occurrence where trends are initially observed in a downward movement as represented in the diagram below.
For the Descending triangle, we have an anticipated bearish trend reversal in an occurrence where trends are initially observed in an upward movement as represented in the diagram below.
Question 6: Investigate the Advantages and Disadvantages of Line charts according to your Knowledge.
Advantages Of Line Chart
- The Line chart is a simple chart analysis that is easy to use with readings easily captured for a possible trade position.
- It only makes use of the closing price that allows for minimal noise or false signals in the market
- Does not require complex computation in deriving the value of a given asset unlike what is obtainable in other indicators relative to available parameters in deriving its value.
- Gives a more accurate result in the longer time frame
Disadvantages Of Line Chart
- Does not show other required parameters which limit the availability of data received from a given indicator
- Due to the lack of opening, high and low price indices, traders may find it difficult to make informed and precise market decisions since there is the basis for such value computation.
- Major market signals like GAPs and other institutional effects of supply and Demand are not captured to help guide traders on taking a position.
- Market is skewed towards having a more precise result in the longer time frame only, hence limiting accuracy in shorter time frames.
Conclusion
The line chart has brought simplicity in the trading experience of traders across the board as little or no experience in trading is required to make a market decision given to its ease of use. In this case, beginners can also lay hands on this chart pattern to maximize profit because of the presence of smoother signals void of false signals as well as closing price without the need to make any complex mathematical calculations to derive asset value.
Just like every other indicator, the Line chart can be combined with other technical indicators for efficiency and performance. No indicator is known as a stand-alone indicator, hence the line chart pattern can be combined with the moving averages, RSI, etc for a precise and accurate trade decision.
Thank you all for reading through my Post.
All screenshots used are images from the TRADINGVIEW site.
Written by @xkool24