My Analysis Of Trxusdt

Hello great minds,
I trust you are all doing perfectly fine and are enjoying activities in the community.
It is a great day and I feel overjoyed to come before you all in this great community today, to share my analysis on trxusdt.
I will be doing a breakdown of topdown analysis of trxusdt beginning from the monthly timeframe, down to the hourly timeframe.
And I will be making use of support and resistance strategy for my analysis, alongside the rsi indicator for trading confluence.
ANALYSIS USING SUPPORT AND RESISTANCE STRATEGY
Like I use to tell, my analysis starts from the higher timeframe, down to the lower timeframe.
From the higher timeframe, I search for the overall market trend as this will influence my trading decisions on the lower timeframe.
On the lower timeframe, I search for entries into the market, entries are very important if you are to apply risk management in trading.
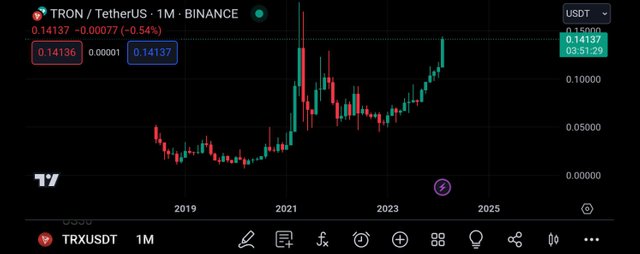
Begining my analysis from the monthly timeframe as usual, I can see how neat the price chart is.
There are no noise in the market as every candle on this timeframe is a valid one.
Also, I was able to detect the trend of the market, and from the screenshot above, I wouldn't say the market is on a bearish trend.
We can see that the current market price has broken a new level in the market, and as such we can say that the pair trxusdt is bullish overall
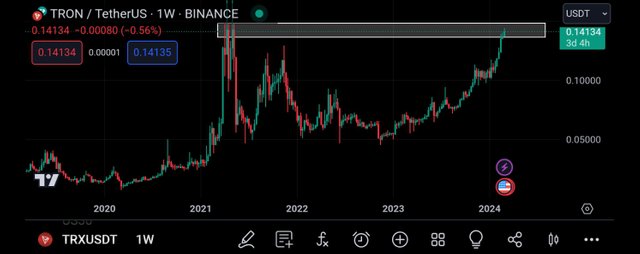
Then I decided to move to the weekly timeframe inorder to continue my analysis.
On the weekly timeframe as I expected, there were more candlesticks on the price chart as each candles were formed within the space of 7days.
And also, I was able to point out a key level on this timeframe, and this level will be functioning as a resistance level to the price chart.
And according to my bias, I expect to see a break of this level which will continue pushing price to the upside.
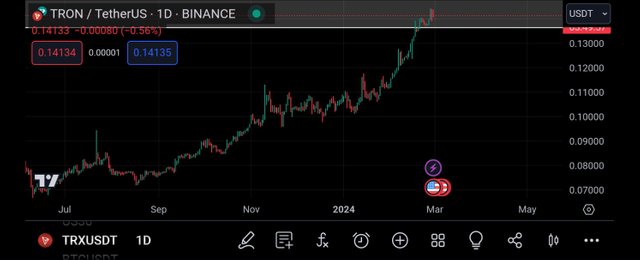
Then I moved to the daily timeframe because my trading strategy requires that I begin from the higher timeframe to the lower timeframe.
On this timeframe, there are lots of market activities, more candlestick of which some are as a result of market manipulation.
I then looked carefully and noticed that the market has approached this key level and I expect to see a rejection candle or an impulsive candle.
Then I decided to check on the lower timeframe for a more clearer view of the market.
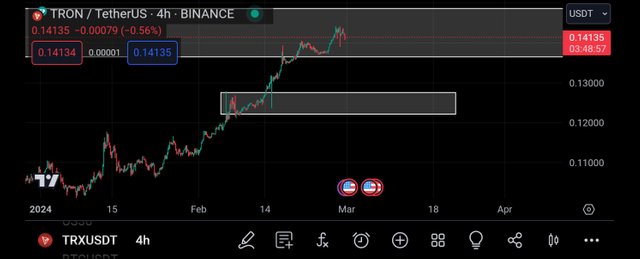
On the 4hr timeframe, there are more candlestick present than on the daily timeframe.
I then noticed that there are formations of rejection candles already on the price chart, and this is in alliance with the concept of support and resistance strategy.
I also looked and I was able to spot a support level which I anticipate the market to retrace to, and when the market gets to this level, I will take a buy of this market pair.
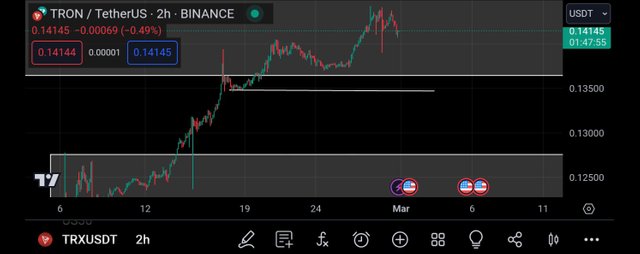
Moving to the 2hr timeframe, I saw more market activities, and the candlestick formed on this timeframe takes a waiting period of 2hrs.
On this timeframe, I was able to spot a level where I'd love to take my profit from if the market moves in my direction.
And with the market structure I have seen, my bias to the market is bearish, and to join the market, I decided to make use of indicator to act as a confluence to my trade.
CONFLUENCE USING RELATIVE STRENGTH INDEX INDICATOR
The relative strength index indicator is an indicator that is used to spot and identify overbought and oversold market regions.
When the market is said to be overbought, this can be seen as a bearish trend reversal signal and when the market is said to be oversold, it can be seen as a bullish trend reversal signal.
And an overbought market can be detected when the oscillator of the Indicator crosses above the 80% line, and an oversold region can be detected when the rsi indicator crosses below the 20% line.
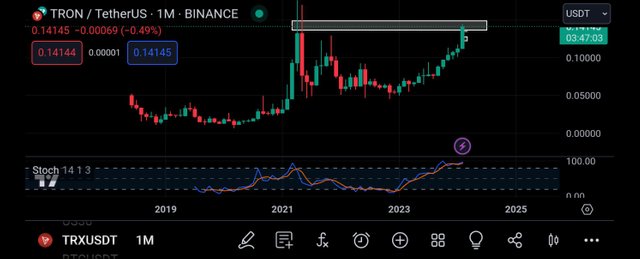
Applying the rsi indicator on the monthly timeframe, I can see that the rsi is above it's 80% line and this is a bearish trend reversal signal.
With this, the market can be said to be overbought and this signal is in allignment with that from the support and resistance strategy.
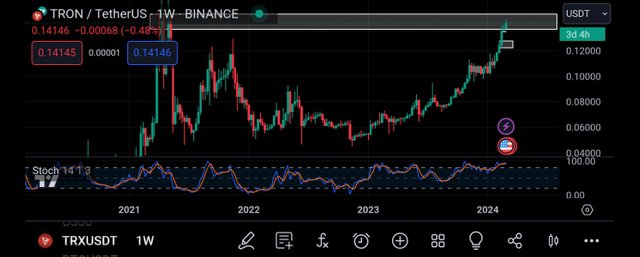
Moving a bit lower to the weekly timeframe, I noticed also that the market is being overbought.
I can see that the rsi has crossed above it's 80% line, and this is a bearish trend reversal signal, just as I got from the support and resistance analysis I carried out
Then I decided to move to the 2hr timeframe in search of entry into the market.
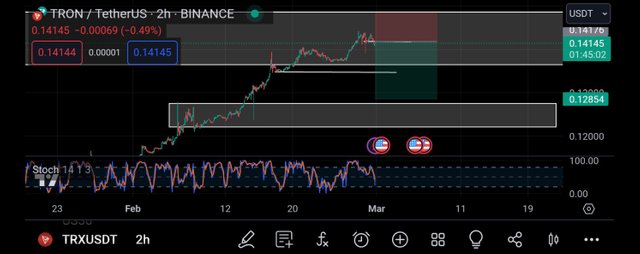
Then coming to the 2hr timeframe, I noticed that the market is no longer being overbought, and this implies that we expect to see few bullish candles before the downward move.
With this, I entered a sell order on the market, and I entered based on the closest resistance level on the market price, and my take profit was placed on the closest support level of the market price.
CONCLUSION
I have shared my personal analysis of trxusdt, and from my analysis, I expect to see a momentarily retracement to the downside.
This post of mine was not created as a financial advise but for educational purpose.
Upvoted! Thank you for supporting witness @jswit.