Analysis Of AVAXUSDT
.png)
Hello great minds,
I feel honored to approach you all today to discuss on a very important issue in the cryptospace.
I believe you are all doing perfectly fine and are enjoying your activities in the community as you actively promote steemit across various social media platform.
Today I will be sharing my analysis on the token of avalanche network which is avax, and I will be sharing my analysis on avax against usdt.
Please stay tuned as I share my analysis
ANALYSIS USING SUPPORT AND RESISTANCE STRATEGY
Technical analysis are best started from the higher timeframe and then to the lower timeframe.
Some analyst prefer starting their analysis from the daily timeframe, down to the fewer minutes, but I begin mine from the monthly timeframe.
The monthly timeframe helps me to compress market activities and display them on a screen.
And the monthly timeframe also helps in eliminating unnecessary noise from the market.
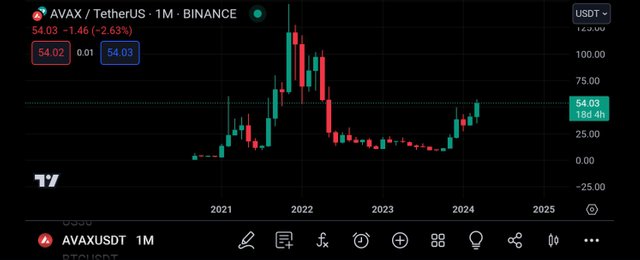
Screenshot above is that of AVAXUSDT on the monthly timeframe, and as we can see, there are presence of buyers and sellers in the market.
From the screenshot above, we can see that there are no market manipulation as every candle was formed after a period of 1month of market activities.
And from the above screenshot, we can see that the market is in an overall bearish trend, although it's latest leg is being bullish, consisting of bullish candles.
Then I moved to the weekly timeframe for more market analysis.
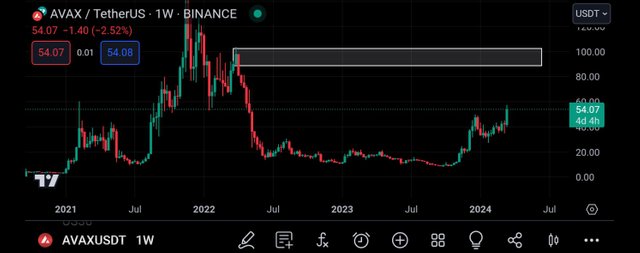
And on this timeframe, I was able to detect a key level, which is a resistance level.
The market has severally tested and respected this level and it is expected for the market to be rejected by this level.
And from the screenshot, we can see that the market is driving towards this marked region, and for more analysis, I moved to the daily timeframe.
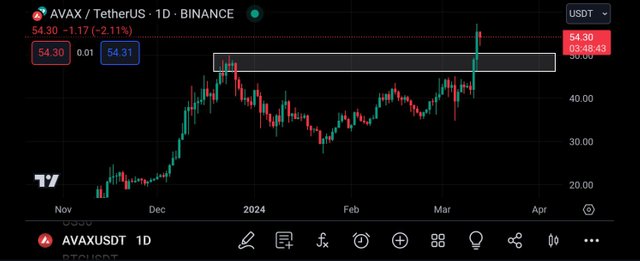
Then I moved to the daily timeframe for more market analysis, and on this timeframe, I saw more market activities.
I can see the buyers and sellers driving price to their preferred direction, and this is leading to lots of impulsive movement in market price.
And on this timeframe, I was able to spot another key level which functioned as a resistance level, until it got broken.
When a level gets broken, we wait for a retest on that broken level, then we can join the market, and this is what I intend doing.
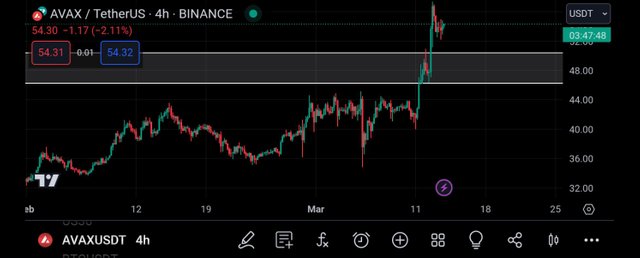
Then I moved to the 4hr timeframe for more market analysis.
On this timeframe, I saw more market candles, as the market candles were formed within the period of 4hrs.
As I looked at the market, I could see retracement candles, I can see that the market is about to retrace to the broken resistance.
And when this happens, I will then join the market to the upside by placing a buy order.
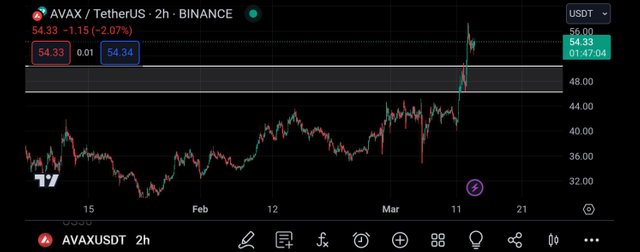
Then I moved to the 2hr timeframe for more market analysis, as it is on this timeframe I enter the market.
Then I looked at the market carefully and decided to wait for the market to get to the broken resistance level before I can place my trade.
And then, I decided to search for confluence using rsi indicator.
CONFLUENCE USING RELATIVE STRENGTH INDEX INDICATOR
The operation of the rsi indicator is no news to us in the community.
The rsi Indicator is used to detect overbought and oversold market regions.
And when an overbought market is detected, it is a bearish trend reversal signal, and when an oversold market is detected, it can be interpreted as a bullish trend reversal signal.
With this understanding, I will be introducing the charts
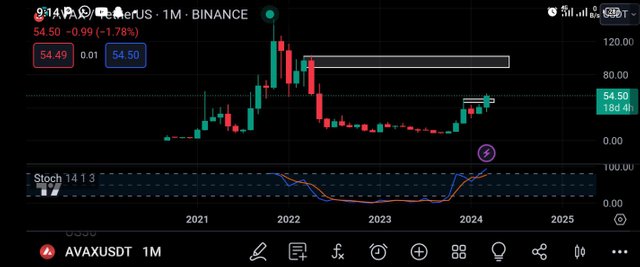
I began again from the monthly timeframe to apply the rsi indicator.
From the screenshot above, we can see that the market is being overbought and this is a bearish trend reversal signal.
Whenever the rsi crosses above the 80% line, the market is said to be overbought and it is signaling a bearish move.
Then I moved to the weekly timeframe for more market analysis.
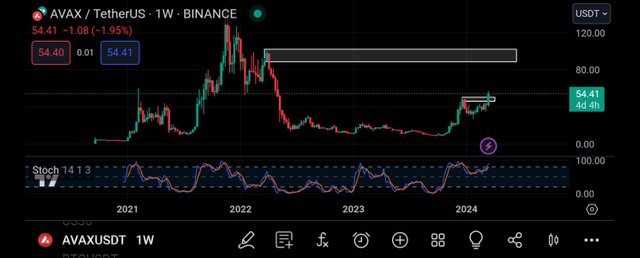
Then I moved to the weekly timeframe to apply the rsi indicator.
On this timeframe, I also noticed that the market is being overbought and this is also a bearish trend reversal signal.
And it is in alliance with our analysis using support and resistance strategy.
Then I moved to the 2hr timeframe in search of entry into the market.
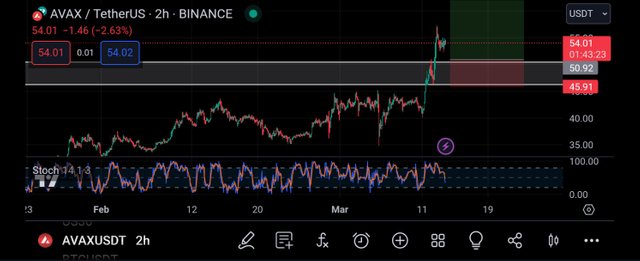
Moving to the 2hr timeframe, I decided to wait for the market to approach the broken resistance level.
While waiting, I placed my entry on this level and placed my take profit in a way that I get a R:R of 1:3.
CONCLUSION
Avalanche is a very nice crypto project in the cryptospace and its native token is what we know to be avax.
And as seen above, I have shared my analysis on AVAXUSDT, and I intend for my post to be taken as an educational content and not a financial advise.
Upvoted! Thank you for supporting witness @jswit.