Silver - Elliott Wave Price Prediction
A lot of traders pay attention to silver for its potential volatility and upside. While silver bulls aren’t partying like there’s no tomorrow, a rally of over 7.4% recently is something worth a little celebration. Their due diligence pays off as silver is one of the most undervalued commodities in the market.
Most experienced traders, institutional or retail, spend their whole life contemplating how to gain analytical or strategic advantages in the highly competitive market environment. It’s a zero-sum game, after all. It’s safe to assume that the market is always one step ahead of the news. Despite the rising interest rate, the market is already predicting that the FED will reverse its course to loosen the monetary policy in the near future. I think this is the probable explanation for the recent market rally.
Silver price is trading above $20 at the time of writing this post. According to the Elliott Wave theory, this 7.4% rally is nothing compared to silver’s future glory. Let me show you.
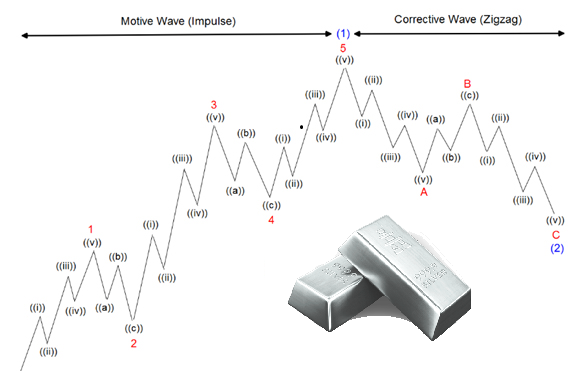
Silver just completed the impulsive move (12345) and corrective move (ABC). A new wave should start to form in the near future.
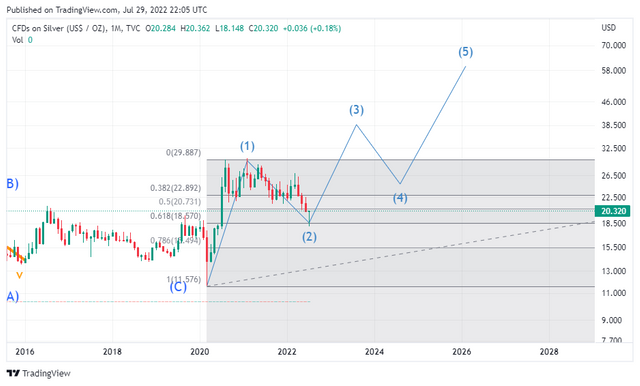
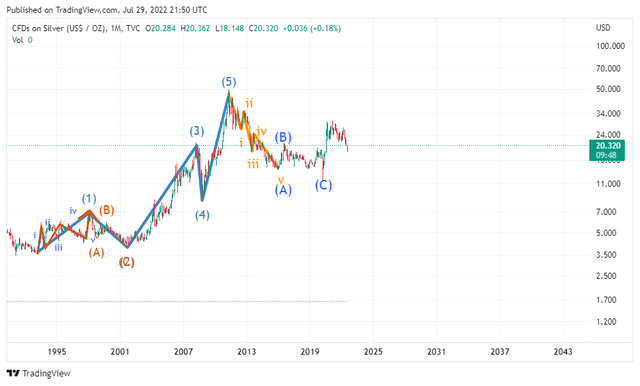
We can see the silver bounced at 0.618, the Fibonacci number, which signifies the possible bottom of the corrective wave (2). Please note that this is just speculation, as I’m not even sure if the (B) wave has ended. The possible scenario is (B) wave might extend to the position of (1), and if that’s the case, we might see more downside as the (C) wave appears. But the fact that silver bounced at 0.618 is a good sign.
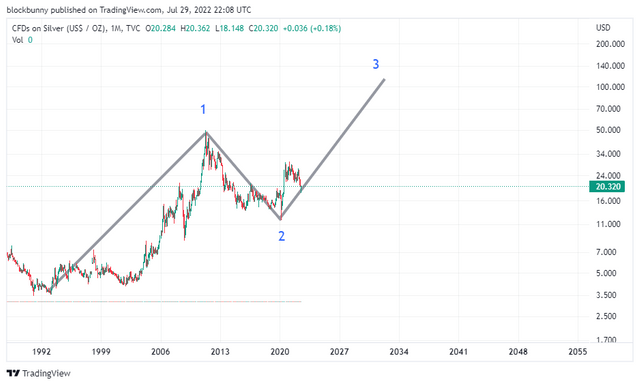
On a bigger scale, all the corrective and impulsive waves are just the inner wave of a bigger wave (1) (2) and (3) (refer to the image at the top). This is very bullish for silver as impulse wave (3) will lead silver to somewhere above $100, and wave (5) will literally send silver price to the moon.
Note that this is just my humble price prediction based on the Elliott Wave theory. Different people might draw the chart differently based on the principle of the Elliott Wave. Elliott Wave disregards fundamental and macroeconomic factors that heavily influence the market. In light of the above, this is by no means financial advice.
You'd be shocked to see any chart I could come up with...
I'm sure you've heard by now that 50 Million Fiat USD's were recently Spent on 90 and 100% Silver and Gold U.S. Coins...
This person could have bought Bars and Rounds or other Sovereign Coins, but our U.S. Coins were chosen...
Do you think it's possible that this person could have listened to someone who's been reading what I've been writing about for the past 5 years...???
I have been writing about the Special Deals the U.S. Treasury will be offering for all our 90 and 100% Silver and Gold Coins...
As per the Fine Tuning of my Monetary Vision, our 90% U.S. Silver and Gold Coins will be offered more Silver and Gold, plus increased Face Values...
Our Silver and Gold Bullion Coins will be offered the same Weights in Silver or Gold, plus increased Face Values...
I would love to read more about your thesis and chart. Where do i start?
Click on your Votes, then click on my screen name... That will take you to all my latest posts... I just posted my latest post today... Always feel free to question anything I write...