An Introduction to Chop Zone Indicator
There are several types of indicators used for analyzing the crypto market chop zone is among the best indicators used by traders, investors, financial analysts, and everyone who deals in the financial markets. It is a stylish indicator that comes with coded colors to provide you with an insight into the trend of the market, which you will learn more about in this post.
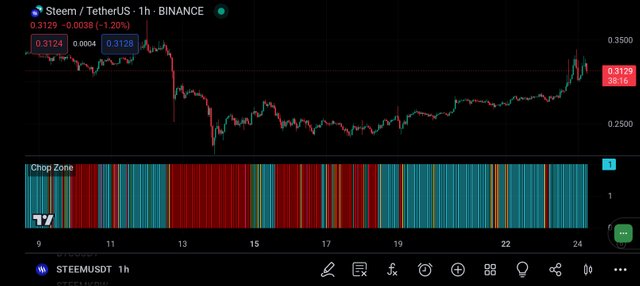
Chop Zone Indicator
It is a stylish indicator that is designed with different colors to help you know the strength and momentum of the financial markets such as the crypto market. Chop zone provides you with an easy-to-understand of coded colors which are in three different forms (red, yellow, and turquoise color).
Tradingview App
Each of the colors in the indicator represents a significant sentiment in the market putting them together helps traders to know the current momentum of the market.
For instance, if the red color changes to a turquoise color or the yellow color vice versa is an indication of possible reversal or change in the direction. The yellow color is a neutral color which doesn't make strong decisions in the market.
In summary, to chop zone indicator, it means an indicator that analyses the recent price action of an asset and the volatility of the asset to generate its color. As a trader, you can combine chop zone indicators with other indicators to analyze the market perfectly.
Colours in Chop Zone Indicator
Tradingview App
As we have discussed earlier, we mentioned three different colors in the chop zone indicator which are well-coded to offer traders an insight into the market. These three colors are:
- Red
- Turquoise
- Yellow/Orange
Red Colour
The red color in the chop zone is an indication of sell-offs in the market. It is also known as the bearish momentum in the market which when you see a deeper red color means there is a stronger sell-off in the asset you are analyzing, whereas a lighter red color means the bearish momentum is not a strong one.
Turquoise Colour
The turquoise color in the chop zone is an indication of a bullish momentum. It is the color that usually appears when the asset you are analyzing is about to begin an upward movement, and you will see the color coming out to let you know that there is future growth in the asset. A deeper turquoise color usually turns to green color which means a stronger bullish momentum.
Yellow/Orange Colour
As said earlier, it is the neutral color that informs traders about consolidation, which suggests to you that the asset you are analyzing is moving in a sideways direction. It is the color that signals a potential breakout or uncertainty in the market.
How to Interpret the Market using Chop Zone
Tradingview App
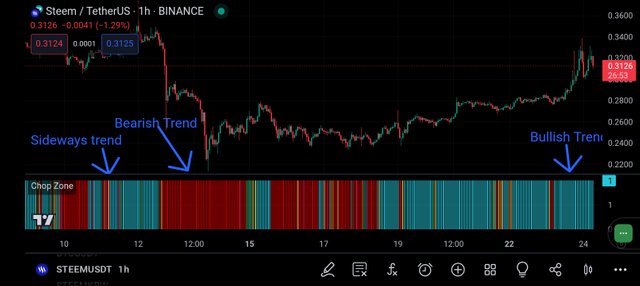
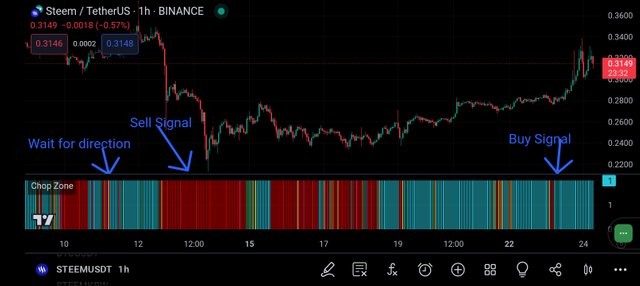
The important aspect of the chop zone is in the color from what we have discussed in the colors if you understand them very well it would be easier for you to interpret the chop zone indicator.
Bullish Trend
As introduced, in bullish trends you will see a transition of the turquoise color into a green turquoise color. If you see such changes you should know that the market can move in an upward direction which is an indication for you to buy or go long as the asset is expected to pump.
Bearish Trend
A bearish market is always presented in a red color which in the chop zone, the red is what indicates a bearish movement. If you see that the red is going deeper, you should open a sell order (Go short) as the market can move downward.
Consolidation Phase
If you see a yellow/orange color, it means the asset you are analyzing is moving in a sideways direction or there is no clear direction in the market. This is the phase where most traders usually wait for the market to come up with a clear direction before making their decision.
Conclusion
Today, we have so far learned what chop zone indicator means and how to interpret the indicator using simple Grammer. Note: this post is not investment advice, but educational content that is written to educate you about chop zone indicators.
The chop zone indicator is a valuable tool for traders in the financial markets, including the crypto market. It uses coded colors (red, turquoise, and yellow) to provide insights into market trends. Red indicates bearish momentum, turquoise signals bullish momentum, and yellow/orange suggests consolidation. By understanding these colors, traders can make informed decisions based on market direction.
Yeah, you are right. Thanks for stopping by.
Thank you, friend!


I'm @steem.history, who is steem witness.
Thank you for witnessvoting for me.
please click it!
(Go to https://steemit.com/~witnesses and type fbslo at the bottom of the page)
The weight is reduced because of the lack of Voting Power. If you vote for me as a witness, you can get my little vote.
https://x.com/AkwajiAfen/status/1783025517840539934
Note:- ✅
Regards,
@jueco