An Introduction to Net Volume Indicator
Hello friends, welcome and stay relaxed as you read through this post which we have discussed about net volume indicator. In the financial markets, you can't do without indicators because of how useful they are.
Net volume indicator is an indicator that is used by traders, investors, financial analysts, and everyone who trades the financial markets to measure the difference between buying and selling an asset which as you keep reading you will get to learn more.
| Net Volume Indicator |
|---|
 Tradingview App
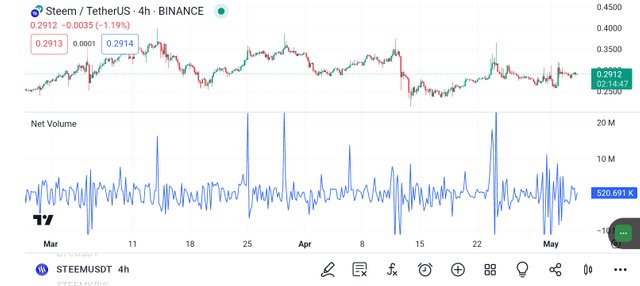
Net volume indicator as the name implies means an indicator that helps you to measure the volume of an asset in the financial markets. It is simply the difference between a small increase in price (uptick) and a small fall in price (downtick) of an asset over a given period.
It is a technical analysis tool that provides you with insights so you can know the overall strength and direction of the market. In a net volume indicator there are two ways to know the market movements which are positive and negative net volume.
The positive net volume means that buying (demand) pressure and volume increase are greater than selling (supply) pressure. The negative net volume is when the selling (supply) pressure is higher than the buying (demand) pressure of whatever asset you are analyzing or already trading.
| Net Volume in Analysing Crypto Market |
|---|
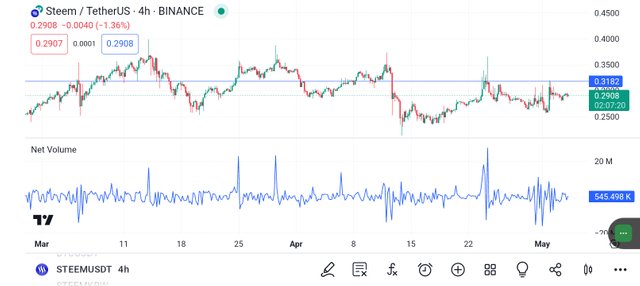
Generally, volume is one of the most common indicators that is used for analyzing the crypto market. The chart of an asset in most of the crypto exchanges usually comes with volume as the default indicator which you can change to a net volume indicator.
 Tradingview App
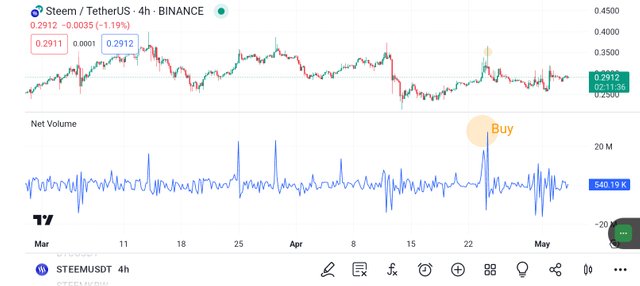
As a trader, you can study the net volume indicator which reflects the pressure of buyers and sellers on the price of the cryptocurrency you want to trade.
However, it is an indicator that can be affected by many factors and fundamental analysis. Like in the crypto market if there is positive news it can boost the demand for cryptocurrency which will lead to seeing a positive net volume higher than the negative volume.
Tradingview offers traders thousands of indicators and a safe environment for analyzing the financial markets which you can take advantage of even if you are a learner. The step shared below can help you get started with Tradingview
Login or Sign up: If you already have an account with Tradingview Login, but you don't you have to sign up.
Select an Asset you want to analyze: Once you have a login you have to select the asset that you want to analyze for trade.
 Tradingview App
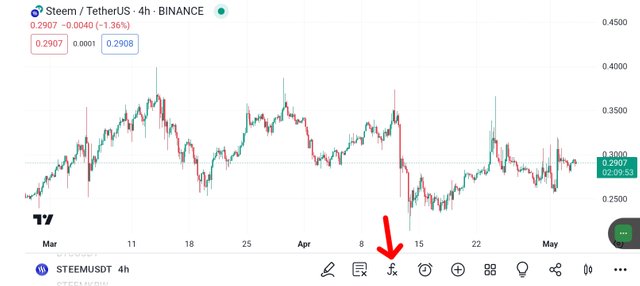
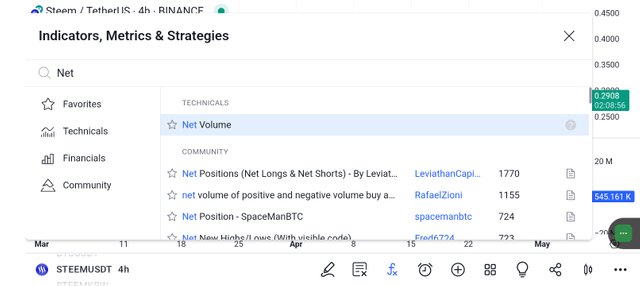
Select the Net volume indicator: Click on the indicator symbol, search, and select the Net Volume Indicator
 Tradingview App
Draw the line of support and resistance levels: Horizontal lines should be for resistance level.
Tradingview App
Place your trade: Wait for a breakout which if you see you can place your trade above the level of resistance and your stop loss the level of resistance.
Watch the market and be ready to take profit: Once the price of the asset has moved to a certain level that gives you profit you can close the trade and take your profit.
Conclusion
Today, we have so far learned what net volume Indicator is best used for knowing buying and selling strength. Note: this post is not financial or investment advice, but educational content that is written to educate you about the net volume indicator.
Thank you, friend!


I'm @steem.history, who is steem witness.
Thank you for witnessvoting for me.
please click it!
(Go to https://steemit.com/~witnesses and type fbslo at the bottom of the page)
The weight is reduced because of the lack of Voting Power. If you vote for me as a witness, you can get my little vote.
https://x.com/AkwajiAfen/status/1786639501269336306
Note:- ✅
Regards,
@theentertainer