Topdown Analysis Of BTCUSDT Using Support And Resistance Strategy And RSI Indicator As A Confluence
Hello great minds,
It is a great opportunity to appear before you all today to share my analysis on bitcoin.
I believe you are all doing perfectly fine and are enjoying your activities in the community as you actively share in steemit promotion across various social media platform.
Bitcoin as we know it, is the father of all other cryptocurrency and it is worth carrying an analysis on, since it is the driver of all other cryptocurrency in the cryptospace.
Today, I will sharing my analysis of btcusdt and I will be beginning from the monthly timeframe.
ANALYSIS USING SUPPORT AND RESISTANCE STRATEGY
My analysis often begin from the higher timeframe and it moves to the lower timeframe.
On the higher timeframe like the monthly timeframe, I identify market trends, and on other timeframe I search for key market levels and also search for entries into the market.
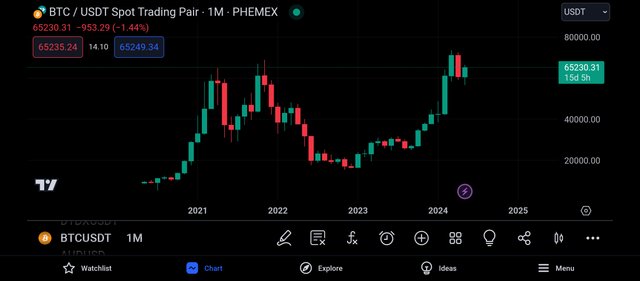
The above screenshot is that of btcusdt on the monthly timeframe as we can all confirm.
And from the above screenshot, we can see that there are less candles on this timeframe, and this is because each candle formed on this timeframe takes an activity period of one month.
Also on this timeframe, we can notice that the market trend is easily identified, and from the screenshot above, we can see that Bitcoin market is bullish overall.
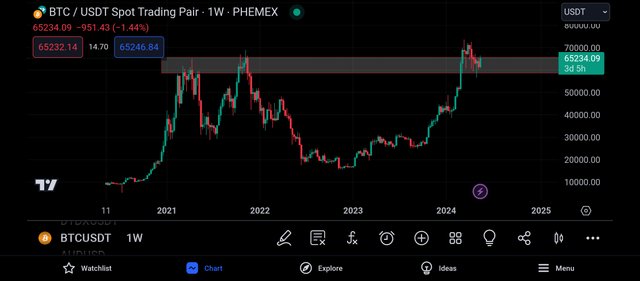
Then I continued my analysis by moving to the weekly timeframe, and on this timeframe I could see more market activities.
And this is because each candle formed on this timeframe takes a time period of 1week to be completely formed.
And on this timeframe also, I was able to spot a key level which is functioning as a resistance level to the price chart, and it is expected for the market to be rejected whenever it gets to this level.
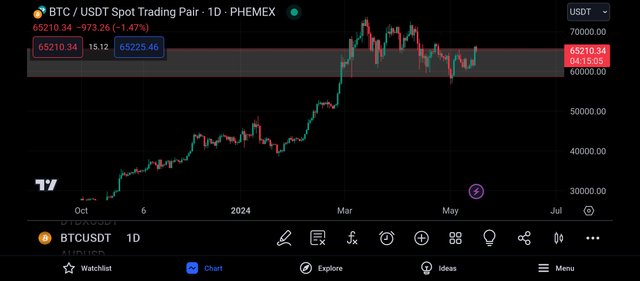
Getting to the daily timeframe, I could see more market activities which is expected as each candle is being formed after a complete market period of 1day.
Then I zoomed into the market and I could see the market price more clearly, I could see the market forming series of lower lows and lower highs as it approaches this level.
And this has given me a bearish bias toward the market and I continued by moving to the 4hr timeframe.
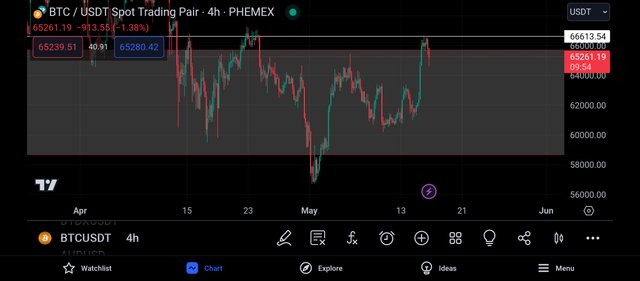
On the 4hr timeframe, I was able to identify a resistance level using an horizontal line on the price chart.
And from the above screenshot, we can see that the market has traded to this level, and we expect to see a bearish rejection which is in alliance with my bias of the market.
And looking carefully at the market, we can see a bearish rejection candle as the market price traded to this level.
And from this rejection, one can take a sell on the market.
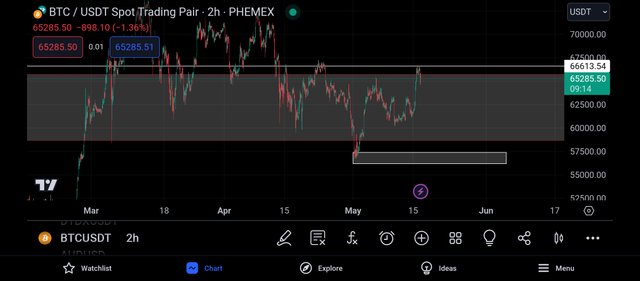
I then decided to continue my analysis on the 2hr timeframe as it is on this timeframe that I search for entry into the market.
On this timeframe, I was able to spot a support level which will be functioning as my take profit level when I place a sell order on the market.
With my bearish bias in mind, I decided to apply the rsi indicator for more confluence to my trade.
CONFLUENCE USING RELATIVE STRENGTH INDEX INDICATOR
The relative strength index indicator is an indicator that helps to identify overbought and oversold market.
When a market is spotted to be overbought, it is a bearish trend reversal signal and when it is oversold, it is a bullish trend reversal signal.
An overbought market can be spotted when the rsi crosses above the 80% line and an oversold market is detected when the market crosses below the 20% line.
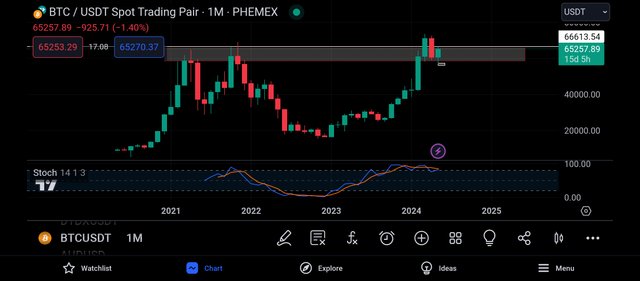
Applying the rsi to the monthly timeframe, I noticed that the rsi has crossed above it's 80% line and this is an Indication of an overbought market.
An overbought market is a market that signals a bearish trend reversal, that is, the market is one that is expected to be sold.
And this is in alliance with my analysis using support and resistance strategy.
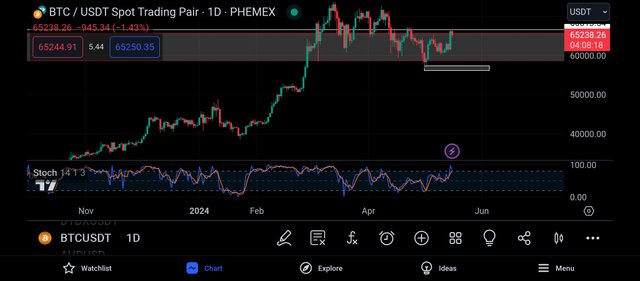
Applying it on the daily timeframe, I noticed that the rsi has crossed above it's 80% line.
And this is also seen as a bearish trend reversal signal, a signal in expectation of the market to go bearish.
And this is in alliance with my analysis using support and resistance strategy.
Then I decided to move to the 2hr timeframe in search of entry into the market.
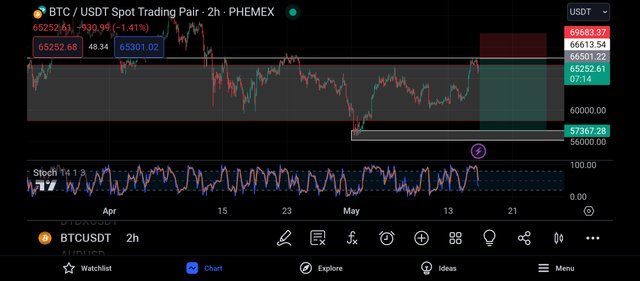
On the 2hr timeframe, I noticed that the rsi was gradually approaching it's 20% line.
And I decided to place my sell entry on the closest resistance level and my take profit was placed on the closest support level to the market price.
CONCLUSION
Bitcoin is the father of all cryptocurrency and it is the driver of all other altcoins in the cryptomarket.
I have shared my analysis on the market and I expect to see a momentary bearish move.
Upvoted! Thank you for supporting witness @jswit.
https://twitter.com/JuecoYoung/status/1791217628033188240