Steem /USDT Technical Analysis - 05.07.2021
(Tradingview Steem /USDT chart)
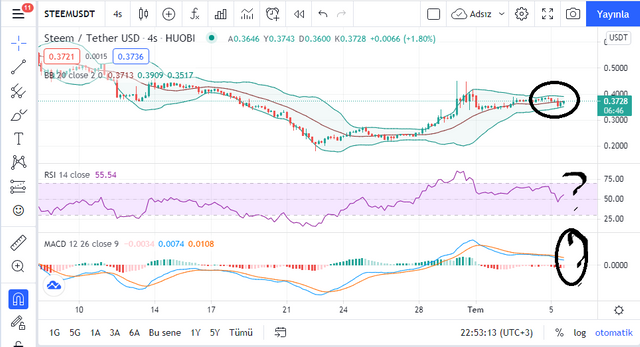
I applied the RSI, MACD and Bollinger band to the Steem /USDT chart. There is no clear signal in all 3 indicators.
Let's look at the Bollinger band first. Steem price bounced back from Bollinger band. This means that the decline may continue a little more.
Its RSI is 55%. There is no data on overbought or oversold.
The MACD line has crossed the signal line downwards. This indicates that the decline may take a little longer. The positive thing is that the MACD line is in the positive territory.
There is no clear signal of where the Steem price will go, but there is a possibility of a decrease in the Steem price.
My thoughts do not contain any investment advice.
Cc:
@steemcurator01
@steemcurtaor02
sir do You have any idea when the steem will rise again.?