Steem /USDT Technical Analysis - 17.06.2021
Cryptocurrencies have been in a downward trend recently. Steem's price, which rose to as high as $1.40 on May 6, 2021, has been in a general decline since then.
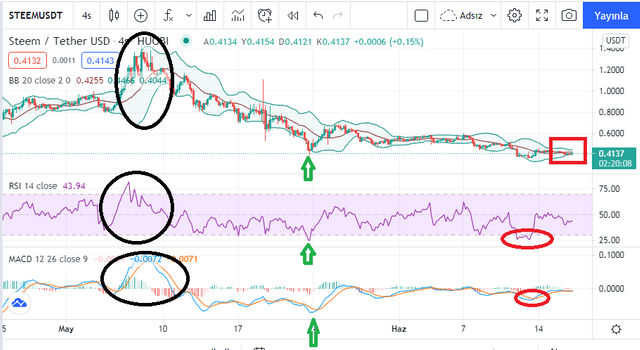
(tradingview Steem /Usdt chart)
On May 6, the Steem price increased too much and touched the upper band of the Bollinger band. In such cases, a downtrend is expected and Steem price continued to decline.
On May 6, the value of the RSI indicator reached 81.87. Above 75 indicates overbought. Again, this indicator was able to successfully predict the start of the decline.
Again on May 6, MACD cut the signal line downwards. In such cases, the trend of the market is bearish.

Steem price decline continues until May 23. Steem price is touching the lower band of the bollinger band. This contact situation indicates that the price will rise. Traders make purchases. After a while, the Steem price increased.
On May 23, the RSI value dropped to 24.80. If the RSI value drops below 25, traders see it as a buying opportunity. After a while, the Steem price started to rise.
The MACD line crossed the signal line upwards in the lunar history. The MACD line is on the negative side but still Steem price has risen well.
On June 13, the price of Steem drops a lot. The Bollinger band considers the possibility that the downtrend will continue for a little longer. There is no buy or sell signal here.
On June 13, the price of steem is falling excessively and its RSI is around 25. This shows that there is a buying opportunity.
The MACD line shows that Steem price will rise after the June 13 drop, but with a little delay. After a 10 hour delay, the MACD line crosses the signal line.
What could be the Steem price these days? All 3 indicators do not give a complete signal.
There is a squeeze in the Bollinger band. In such cases, it indicates that a fluctuation will start and the price will increase or decrease a lot. Steem price needs to cut the Bollinger band middle band in order to rise. If Steem price continues like this for a while, we can expect an upward increase.
The RSI indicator does not produce any signals.
There are no signals on the MACD indicator. The MACD line is in the negative territory. Steem price could rise more wildly if the MACd line moves into the positive zone.