Crypto Mania! Check the Potential of Bitcoin Cuan to Ripple in May
1. Crypto Mania! Check the Potential of Bitcoin Cuan to Ripple in May

The price of bitcoin, the cryptocurrency with the largest market cap, fell 3.64% to US $ 56,802.9 / BTC. In mid-April, bitcoin scored an all-time high of US $ 64,899.97 / BTC. Then ethereum shot up 42.55% and ended April at US $ 2,765.21 / ETH, and set an all-time high of US $ 2,806.5 / ETH on March 30. But the record is only less than 24 hours old, ethereum continues to set new records until trading Monday (3/5/2021) at US $ 3,203.18 / ETH. Meanwhile, ripple was able to skyrocket 179.23% to US $ 1.5757 / XRP over the past month. The rise in ripple could even have been much bigger had it not slumped in the last 2 weeks of April. Bitcoin is arguably the driving force behind other cryptocurrencies, due to its growing acceptance. The increase can lead to increases in other cryptocurrencies by varying percentages.
In April, for example, bitcoin prices shot up in the first two weeks, but subsequently slumped. This movement was followed by other cryptocurrencies, but unfortunately the percentage slump was bigger which made bitcoin record a monthly decline, but other cryptocurrencies strengthened. What is clear, the movement is in tune, only differentiated by the percentage of increase or decrease. Alex de Vries, an economist from the Netherlands who owns the Digiconomist website, as reported by Fortune, Monday (28/4/2021), said that bitcoin has benefited greatly from the current economic recovery. Although it is still questionable how big the correlation is.
The United States (US) as the motor of the world economy shows a high recovery.
Last week, the US reported that in the first quarter of 2021, its economy grew 6.4%. This growth shows that the US economy has begun to recover after experiencing a recession due to the corona virus disease pandemic (Covid-19).
In fact, many economists, including the Fed, predict that this year's gross domestic product (GDP) will be the best since 1984.
The Fed in March projected a gross domestic product (GDP) of 6.5% this year, much higher than the projection given in December last year of 4.2%.
Meanwhile, the International Monetary Fund (IMF) in the April edition of the World Economic Outlook, predicts that US GDP will grow 6.4%, higher than the January projection of 5.1%.
In addition, the US central bank (The Fed) also emphasized that it will not change its policy in the near future even though the US economy has shown a high recovery. This means that the Fed's policy will still be ultra loose.
This policy is one of the reasons for bitcoin CS soaring. The ultra-loose policy made the US economy flooded with liquidity, and partly entered financial markets, including into cryptocurrencies.
This means that the economic recovery and ultra-loose policies will still support the strengthening of cryptocurrencies in May.
2. Bitcoin has the potential to print a record at US $ 67,000 / BTC

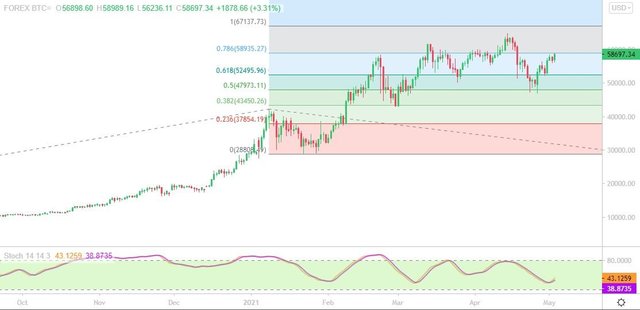
Technically, the potential for continued strengthening of bitcoin to record another record this month is wide open. The condition is that Bitcoin must pass the 78.6% Fibonacci Extension in the range of US $ 58,000 to US $ 59,000 / BTC, and consistently stay above it. Fib. The extension was withdrawn from the 2020 low of US $ 5,533.5 / BTC on March 13, and the highest level this year before experiencing a correction of US $ 41,998.75 / BTC on January 8, and the last point at the lowest level after experiencing a correction of US $ 28,745.55 / BTC on January 22, 2021. Meanwhile, the stochastic indicator on the daily chart is moving up and is still far from overbought territory.
source
Stochastic is a leading indicator, or indicator that initiates price movements. When Stochastic reaches the overbought area (above 80) or oversold (below 20), the price of an instrument has a chance to reverse.
Stochastic which has not reached overbought yet provides room for further increases in prices.
As long as it stays above the Fib. Extension 78.6%, bitcoin has a chance to strengthen to Fib. 100% extension in the range of US $ 67,000 / BTC.
Meanwhile, if stuck below the Fib. Extension 78.6%, bitcoin risk is corrected to US $ 52,000 / BTC (Fib. Extension 61.8%) before hitting US $ 47,0000 / BTC which is the Fib. Extension 50%, and proved strong to hold down the slump in bitcoin at the end of April.
3. Ethereum Faces Fib. Extension 100%

source
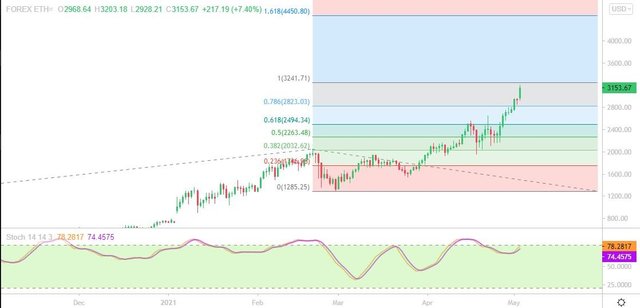
Ethereum continues to set all-time highs, so resistance levels by looking at the movement pattern are certainly not there. Therefore, the technical indicators used are also Fib. Extension like in bitcoin.
Fib. The extension was withdrawn from the 2020 low of US $ 85.9 / ETH on March 13, and the highest level this year before experiencing a correction of US $ 2,047 / ETH on February 20, and the last point at the lowest level after experiencing a correction of US $ 1,293. 2 / BTC on February 28, 2021.
As a result, ethereum is now near Fib. 100% extension in the range of US $ 3,200 / ETH.
source
Meanwhile, the stochastic indicator on the daily chart is moving and is almost overbought.
So that the Fib combination. 100% Extension and the Stochastic will be a strong resistance. This means that if ethereum fails to cross US $ 3,200 and stays consistently above it, there is a risk of a correction down to US $ 2,800 / ETH, to US $ 2,400 / ETH.
Conversely, if it is able to break the Fib level. Extension at 100% and staying above it, there is the potential for ethereum to skyrocket to a range of US $ 4,400 / ETH (Fib. Extension 161.8%).
4. Ripple Berpotensi Bentuk Double Top

source
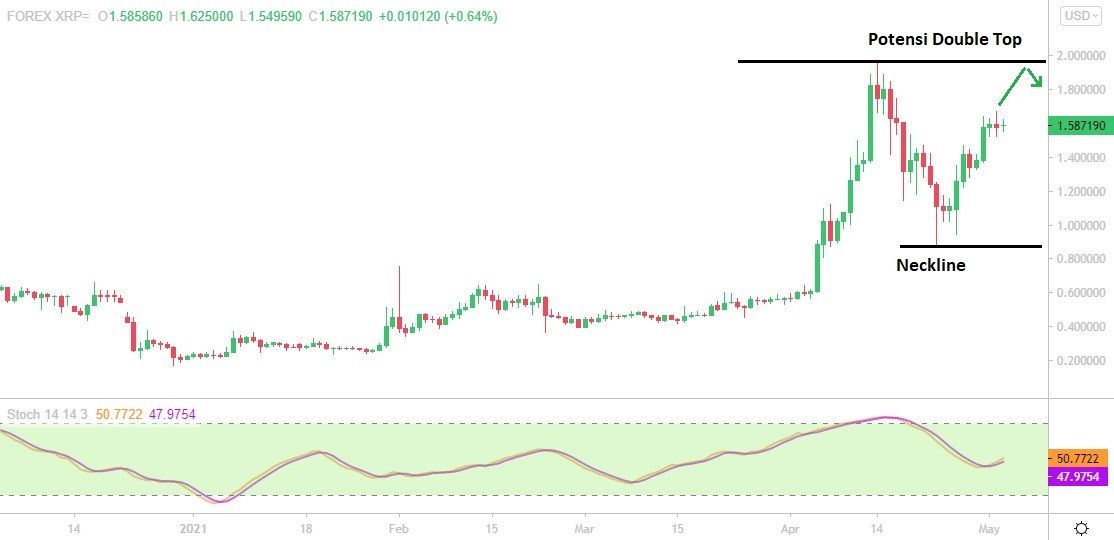
Ripple did skyrocket last April, but turned around in the past two weeks before it could rebound.
Seeing the stochastic indicator moving up and far enough from the overbought area, the room for ripple strengthening is certainly still wide open. But when later it goes up and reaches overbought, it will be risky to be corrected to form and form a Double Top pattern. This pattern is a signal of a reversal in the direction of an asset. A Double Top pattern can occur if the ripple approaches or reaches or is slightly higher than the April highs of US $ 1,973 / XRP and then turns down.

source
The Double Top pattern nekline will be in the range of US $ 0.883 / XRP (April low), if this level is broken later, the ripple is at risk of falling sharply.
But if the highs of April 1, 973 / XRP are far past, and are able to hold above them, then the Double Top pattern will not occur, and ripple has the potential to accelerate. Moreover, these highs are very close to the psychological level of US $ 2,000 / XRP which can determine the direction of the ripple's movement.
Forgive me if my writing in English is still bad. Because I just learned to write in English
Thank you very much to the steemian friends who have been willing to support and motivate and visit my post about PROMOSTEEM. Special to @arie.steem, @stephenkendal, @steemcurator01, @steemcurator02, @steemcurator03, @booming01, @booming02, @stephenkendal, @dobartim, @cryptokannon, @xpilar, @justyy, and @pennsif
Thank you for visiting us, I hope this news is useful. And this news has been published on CNBC INDONESIA in Indonesian
source