DOGE COIN 6 HOUR PRICE CHART - PREDICTION ✔️
⭐️ DOGECOIN SIX HOUR CHART ⭐️
before the rally…
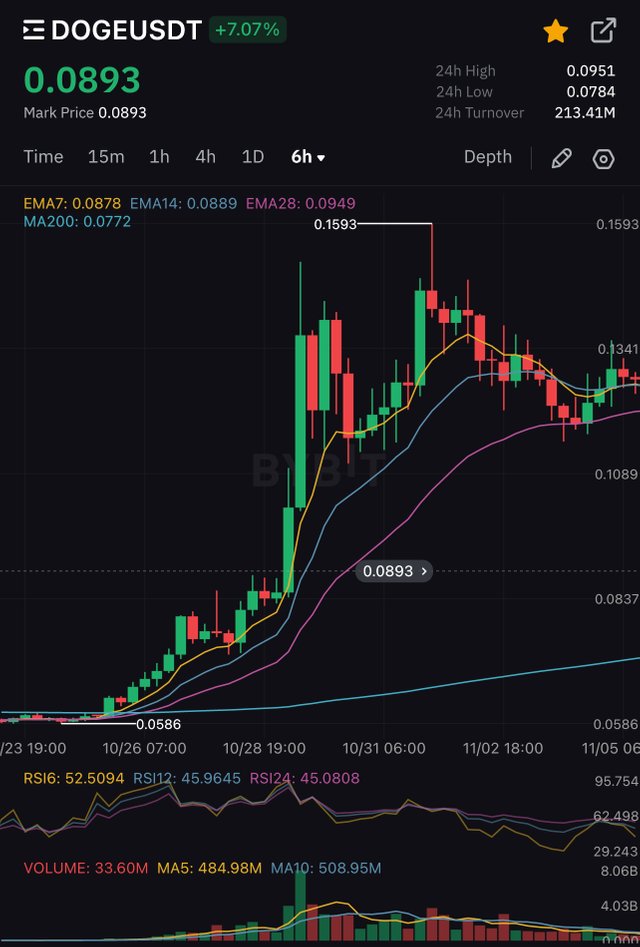
As you can see, as soon as the price managed to break the resistance at the 200 MOVING AVERAGE (the light blue line) and all the EMA’s at about the same time then the price took off from about 0.06 USDT.
You can also see that the price respected the EMA 7 line(the gold line) all the way up to the top just below the 0.16 USDT area.
You can also see the divergence between the RSI and DOGECOIN price. The RSI is making lower highs, while the price is making higher highs.
Now the price has bounced off up the EMA 7 at about 0.13 USDT to about 0.1593 USDT.
Now the price needs to go back down and these the EMA 7 to see if it’s still going to respect it and then should bounce up from their, however we’ve just had divergence at the same time and the gap between the EMA 7, 14 and 28 is to big. If we were continuing up then we’d still need to sit at about the 0.13 and 13.5 range until the EMA 14 and 28 caught up
The price needs to respect the EMA 28 (the purple line) as it now broke below the EMA7 and 14 but remember we just had that divergence and the 200 MOVING AVERAGE is still away down at about the 0.75 to 0.80 USDT range.
⭐️ DOGECOIN 6 HOUR CHART ⭐️
after the rally…
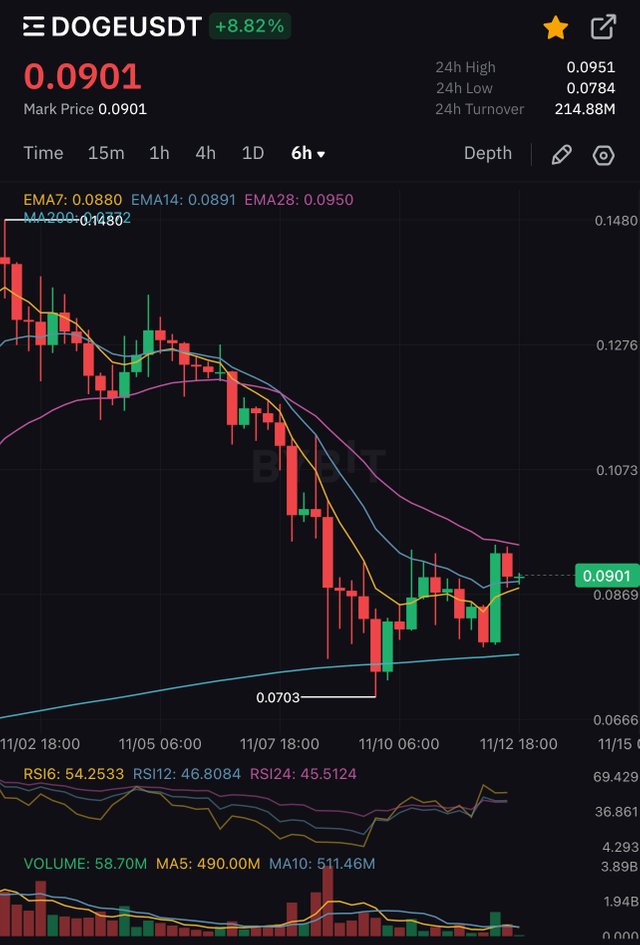
As you can see at about the 0.125 USDT dropped below all the EMA’s, the price dropped all the way down to about 0.07 USDT and bounced at about the 200 MOVING AVERAGE at about the 0.07 USDT range.
You can see it’s broke through the 7 and 14 EMA and is respecting the resistance at about the 0.095 USDT range
CONCLUSION ⬇️
I think the price is going to drop down and test the 200 MOVING AVERAGE again.
This time when it retests the 200 MA all the RSI’s and MOVING AVERAGES will have no gap and should be lined up very well for the next move.
To be honest, I don’t know.
We could sit at the 200 MA and range, or we make a real move either to the upside or downside. I believe it all depends on what happens at this 200 MA. I could be wrong though.
I can also show you the other time frames for doge and show how I believe they are all lining up to take us down to the 200 MA on the 6H, 12 and 1D charts. All the lower timeframes are also lining up and putting us there.
I’m not a professional I’m just saying what I see and believe. If you have any further input or you think I’m wrong then please let me know.
Thanks…
Thanks for using steemegg
Thank you, friend!


I'm @steem.history, who is steem witness.
Thank you for witnessvoting for me.
please click it!
(Go to https://steemit.com/~witnesses and type fbslo at the bottom of the page)
The weight is reduced because of the lack of Voting Power. If you vote for me as a witness, you can get my little vote.
Upvoted! Thank you for supporting witness @jswit.
You got a 36.23% upvote from @dkpromoter!
Get Daily Return by delegating to the bot and earn a passive income on your spare SP while helping the Steem Community
500 SP 1000 SP 2000 SP 5000 SP 10000 SP 20000 SP