The S&P 500 Hit the Downside Target Discussed on the Scaredy Cat Investor Show
During the scaredy cat investor show we took a look at the S&P 500 chart given the carnage happening in the markets.
Though price was already short-term oversold we quickly recognized the next downside levels price could reach before rebounded.
Primary Target Hit
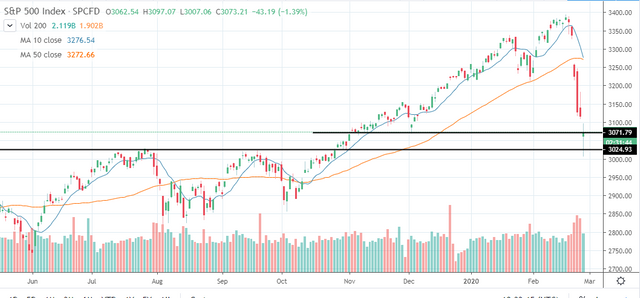
Looking at the chart you will see two horizontal lines. The higher one was the potential support given there was a gap reversal at that level back on December 3rd.
However, the real support came at 3,025 a level that represented a strong prior resistance where price failed twice before finally rallying through to take the market to new highs.
Today's gap down and early sell off took the market to that level before seeing a bounce this afternoon.
The real question is will we see any follow through. With two hours still left in the market today anything can happen, but a green candle today would bode well for atleast a short-term oversold bounce.

Posted via Steemleo